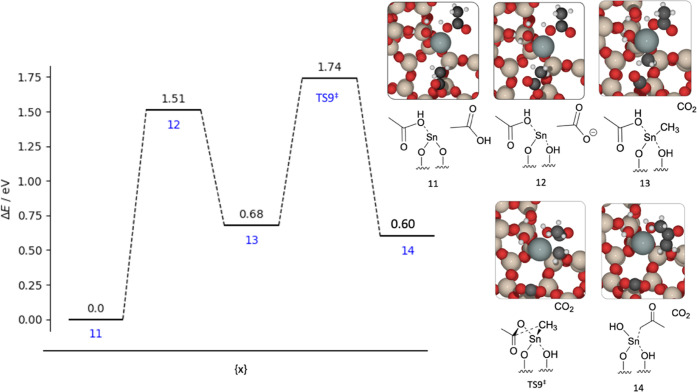
Figure 8.
Graph of the reaction energies (ΔE) and kinetic barrier (Eact) for ketonization of acetic acid to acetone and carbon dioxide across Lewis acid Sn(II) site. Energies are calculated with periodic DFT. Insets: visual representation of the structural intermediates, with structure numbers as labeled. Red, beige, white, black, and gray atoms represent O, Si, H, C, and Sn, respectively.

