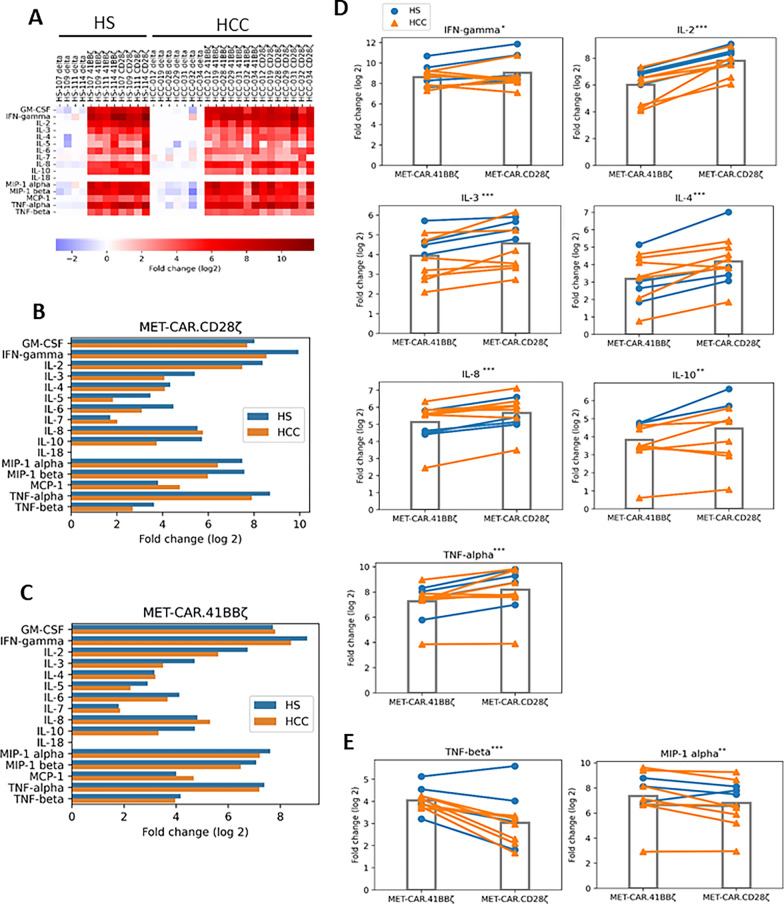
Fig. 4.
Cytokine release from MHCC97H-stimulated MET-CAR-T cells. A Heatmap analysis of multi-panel cytokine release by MET-CAR-T cells generated from HS and HCC patients. B–C Comparison of 16 cytokines released by MET-CAR.CD28ζ T cells (B) or MET-CAR.4-1BBζ T cells (C) between HS (n = 4) and HCC (n = 7) groups. D–E Cytokines that are produced significantly higher in MET-CAR.CD28ζ T cells (D) or MET-CAR.4-1BBζ T cells (E). *Paired t test, p < 0.01 only in HS group; **Paired t test, p < 0.05 in both HS and HCC groups; ***Paired t test, p < 0.01 in both HS and HCC groups

