Fig. 5.
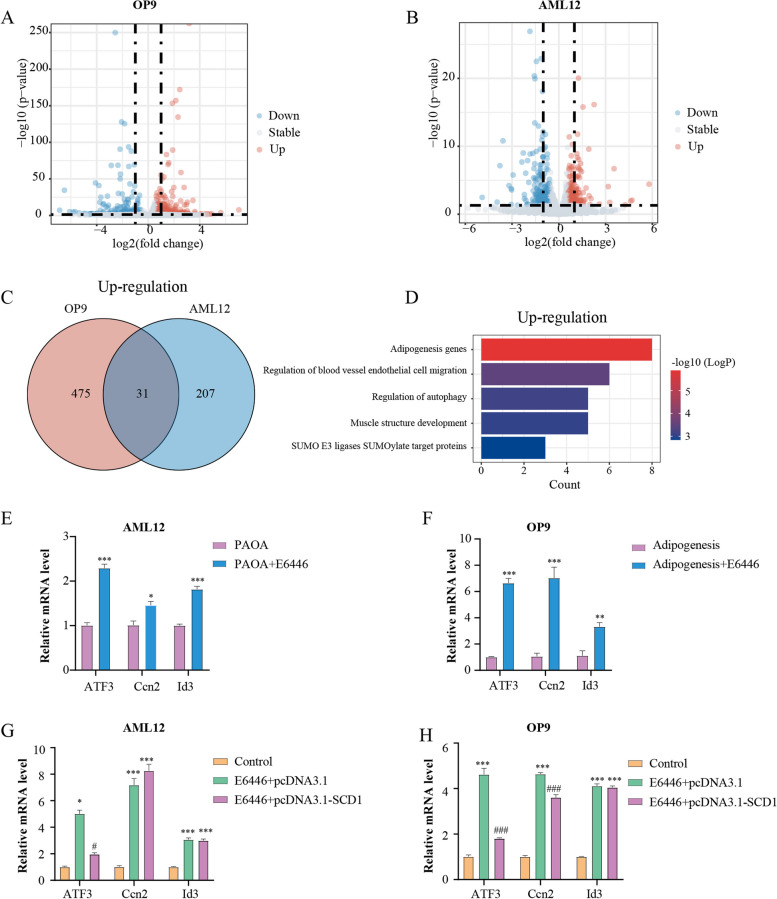
Transcriptomics implicates ATF3 as a potential downstream regulator. RNA-Seq was obtained from OP9 cells after 15 days and AML12 cells after 48 h with or without E6446 under model treatment. Volcano plot of the differentially expressed genes (DEGs) in OP9 (A) and AML12 cells (B). The Venn diagram (C) illustrates the common upregulated genes in OP9 and AML12 cells. D GO analysis of common upregulated genes in OP9 and AML12 cells. The top 3 genes with expression of adipogenesis gene terms in OP9 (E) and AML12 cells (F). G-H OP9 and AML12 cells were transfected with pcDNA3.1 vector or pcDNA3.1-SCD1. The relative mRNA levels of Id3, Ccn2 and ATF3 were measured with RT–qPCR after model establishment. The values presented are the means ± SEMs of three independent experiments. *P < 0.05, **P < 0.01, ***P < 0.001 vs. the Control group. #P < 0.05, ###P < 0.001, vs. the E6446 + pcDNA3.1 group

