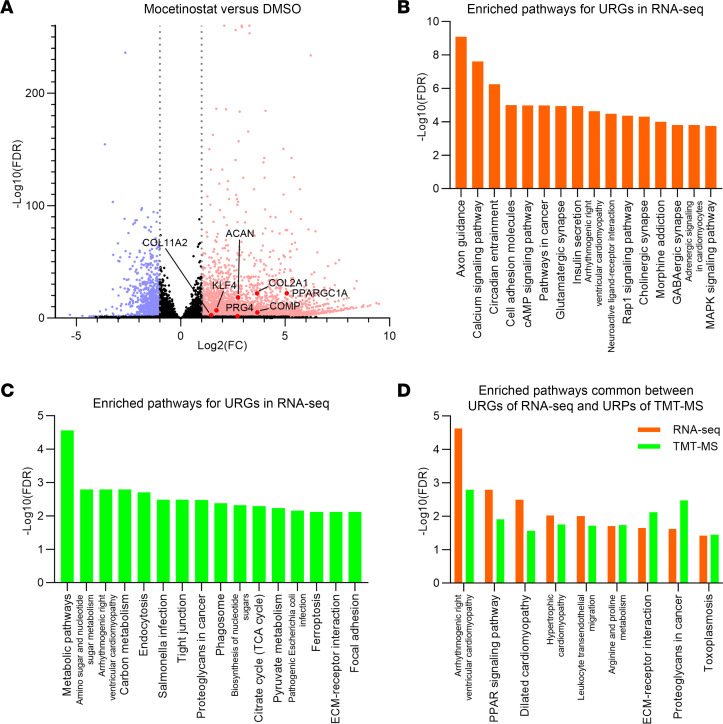
Figure 6. Global transcriptomics and proteomics analyses of mocetinostat- versus DMSO-treated TC28a2 cells.
Cells were treated with 2 μM of mocetinostat or DMSO for 24 hours. n = 3 per condition from 3 independent experiments were analyzed by high-throughput RNA-Seq and tandem mass tag–mass spectrometry (TMT-MS). (A) Volcano plot of RNA-Seq data to identify differentially expressed genes (DEGs). Gray dotted lines indicate |log2(fold change [FC])| = 1. Significantly upregulated genes (URGs) are shown as red dots, while significantly downregulated genes (DRGs) are indicated as blue dots; black dots represent nonsignificant DEGs. (B) KEGG pathway analysis using URGs of RNA-Seq data. The top 16 enriched pathways are shown. (C) The top 16 enriched pathways in KEGG pathway analysis using significantly upregulated proteins (URPs) of TMT-MS data. (D) Enriched pathways common between URGs of RNA-Seq data and URPs of TMT-MS data.

