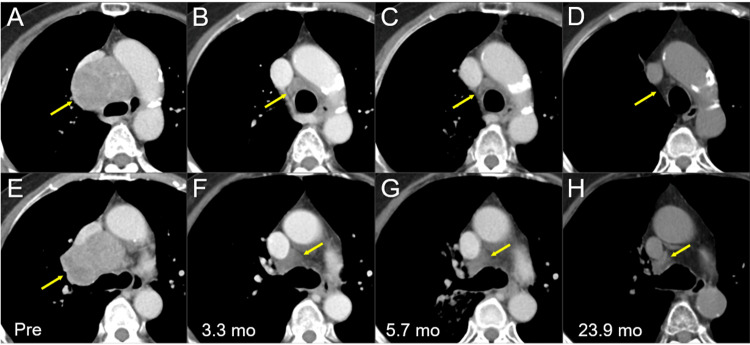
Figure 1. Thoracic computed tomography images before and after chemoradiotherapy.
The images show axial (A-C, E-G) CE CT images and axial (D, H) non-CE-CT images (A, E) 28 days before (Pre) the initiation of CRT, (B, F) at 3.3 mos after CRT initiation (after four courses of EC), (C, G) at 5.7 mos (after six courses of EC), and (D, H) at 23.9 mos.
(A-H) These images are shown at the same magnification and to some extent the same coordinates under co-registration and partly manual fusions. (A, B) Well-demarcated heterogeneously enhanced mass lesions (arrows in A and E) in the mediastinum and right hilum, with the displacement of the trachea, bilateral bronchi, esophagus, and superior vena cava. (B, C, F, and G) The lesions regressed remarkably, however, still leaving the residual masses (arrows in B, C, F, and G). (D, H) The residual mass lesions further regressed (arrows in D and H) at 23.9 mos.
CE, contrast-enhanced; CT, computed tomography, CRT, chemoradiotherapy; mo, month; EC, etoposide plus cisplatin

