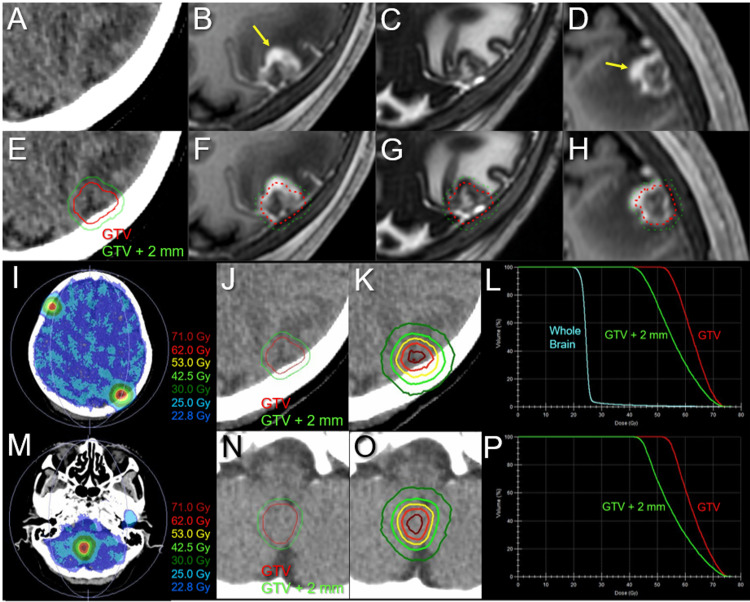
Figure 10. Target definitions, dose distributions, and dose-volume histograms for the third 10-fr stereotactic radiosurgery combined with simultaneous whole-brain irradiation.
The images show (A, E) non-CE-CT images and (B, D, F, H) CE-T1-WIs, (C, G) T2-WIs, (I, K, M, O) dose distributions, (E-H, J, N) target definitions, (L, P) DVHs, (A-C, E-G, I-K, M-O) axial images, (D, H) sagittal images, (A-L) the left parietal lesion with local progression following prior SRS, and (M-P) the new right cerebellar lesion.
(A-H) These images are shown at the same magnification and coordinates under co-registration and fusions. (A-H) The GTV was defined, mainly based on the visible mass on the T2-WIs (C, G), with the exclusion of excessive exudation of contrast media (arrows in B and D) by contrasting CE-T1-WIs and T2-WIs (T1/T2 matching). (E, J, N) The GTVs and isotropic 2-mm margin-added structures. (I, K, M, O) The representative isofill doses (I, M) and IDLs (K, O) superimposed onto non-CE-CT images. (I, L, M) D98% and D50% of the whole brain are 22.8 and 24.5 Gy, respectively.
CE, contrast-enhanced; CT, computed tomography; WIs, weighted images; DVHs, dose-volume histograms; SRS, stereotactic radiosurgery; GTV, gross tumor volume; IDLs, isodose lines; DX%, a minimum dose encompassing at least X% of the target volume; fr, fraction

