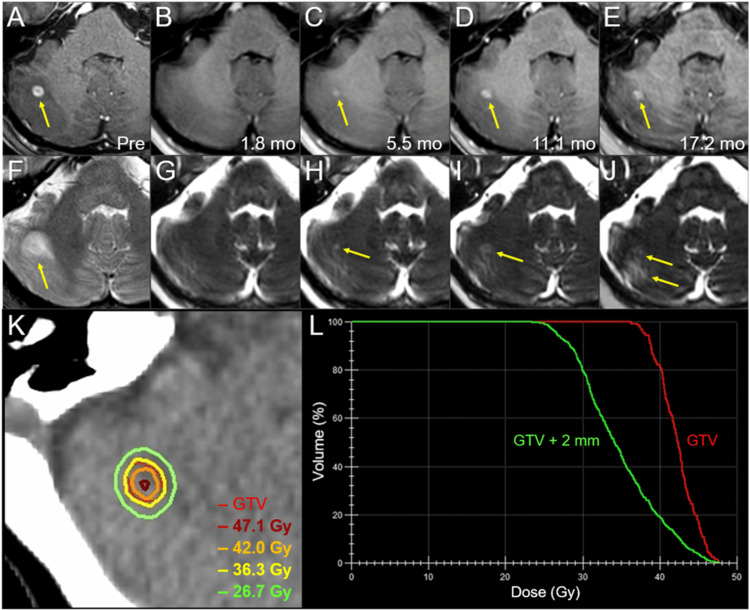
Figure 3. Magnetic resonance images, dose distribution, and dose-volume histograms before and after the first three-fraction stereotactic radiosurgery in the right cerebellar lesion.
The images show (A-E) axial CE-T1-WIs and (F-J) axial T2-WIs (A, F) five days before (Pre) the initiation of SRS, (B, G) at 1.8 mos after SRS initiation, (C, H) at 5.5 mos, (D, I) at 11.1 mos, and (E, J) at 17.2 mos; (K) an axial dose distribution; and (L) DVHs.
(A-J) These images are shown at the same magnification and coordinates under co-registration and fusions. (A, F) A solid enhancing lesion (arrow in A) with the corresponding mass on T2-WI (T1/T2 match) associated with perilesional edema (arrow in F) in the right cerebellar hemisphere. (B, G) At 1.8 mos, the lesion regressed completely. (C-E, H-J) The enhancing effect gradually increased (arrows in C-E); however, the corresponding mass on T2-WI remained obscure (T1/T2 mismatch) and the perilesional edema was mild (arrows in H-J). (K) The GTV contour (thin line) and representative IDLs (thick lines) are superimposed onto an axial CT image. (L) The GTV + 2 mm structure was generated by adding an isotropic 2-mm margin to the GTV for the evaluation of the dose gradient outside the GTV boundary.
CE, contrast-enhanced; WIs, weighted images; SRS, stereotactic radiosurgery; CT, computed tomography; DVH, dose-volume histogram; mo, month; GTV, gross tumor volume; IDL, isodose line

