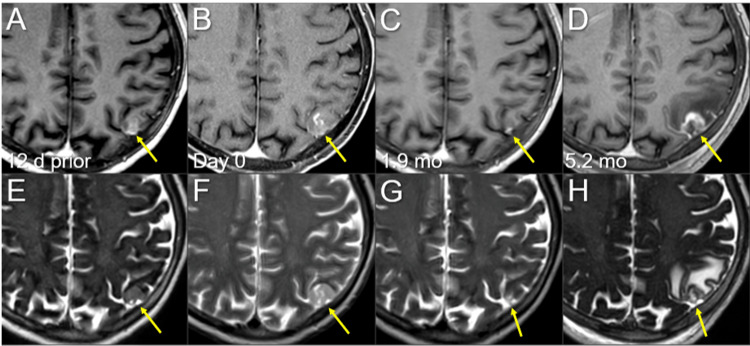
Figure 4. Magnetic resonance images before and after the second single-fraction radiosurgery of the left parietal lesion.
The images show (A-D) axial CE-T1-WIs and (E-H) axial T2-WIs (A, E) 12 days before (12 d prior) the second SRS (11.8 mos after the initiation of CRT); (B, F) on the day of SRS (day 0); (C, G) at 1.9 mos after the second SRS; and (D, H) at 5.2 mos (17.3 mos after CRT).
(A-H) These images are shown at the same magnification and coordinates under co-registration and fusions. (A, E) A heterogeneously enhancing lesion (arrow in A) without perilesional edema (arrow in E). (B, F) Notably, the lesion increased in size with higher intensity on T2-WIs (arrows in E and F) in 12 days, and the contrast enhancement is faint and partial (arrow in B) compared to the visible mass on T2-WI (T2-mass, arrow in F), that is, a paradoxical T1/T2 mismatch. Furthermore, the main location of the lesion is the brain surface, the cerebral cortex, with partly exophytic growth beyond the brain surface and attachment to the adjacent dura mater. (C, G) At 1.9 mos, the lesion shrank remarkably (arrows in C and G). (D, H) The enhancing lesion and T2-mass obviously increased (arrows in D and H), along with the development of perilesional edema.
CE, contrast-enhanced; WIs, weighted images; SRS, stereotactic radiosurgery; CRT, chemoradiotherapy; mo, month

