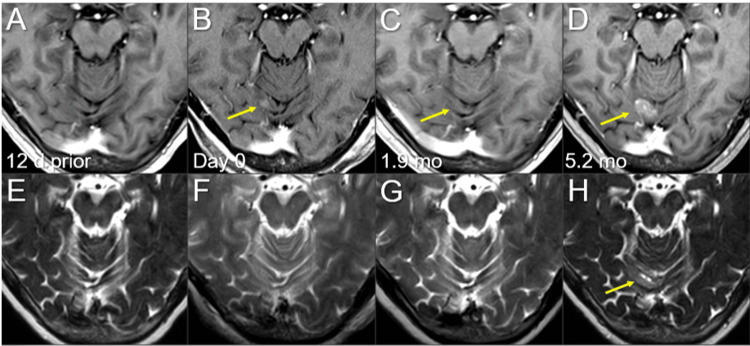
Figure 6. Magnetic resonance images before and after the second single-fraction radiosurgery of the right cerebellar lesion.
The images show (A-D) axial CE-T1-WIs and (E-H) axial T2-WIs (A, E) 12 days before (12 d prior) the second SRS (11.8 mos after the initiation of CRT); (B, F) on the day of SRS (day 0); (C, G) at 1.9 mos after the second SRS; and (D, H) at 5.2 mos (17.3 mos after CRT).
(A-H) These images are shown at the same magnification and coordinates under co-registration and fusions. (A, B, E, F) A solid enhancing lesion (arrow in B) appeared in 12 days. (C, G) At 1.9 mos, the lesion almost disappeared (arrow in C). (D, H) The enhancing lesion increased remarkably beyond its original size, along with the T2 mass (arrows in D and H).
CE, contrast-enhanced; WIs, weighted images; SRS, stereotactic radiosurgery; CRT, chemoradiotherapy; T2 mass, a visible mass on T2-WIs; mo, month

