
Figure 5—
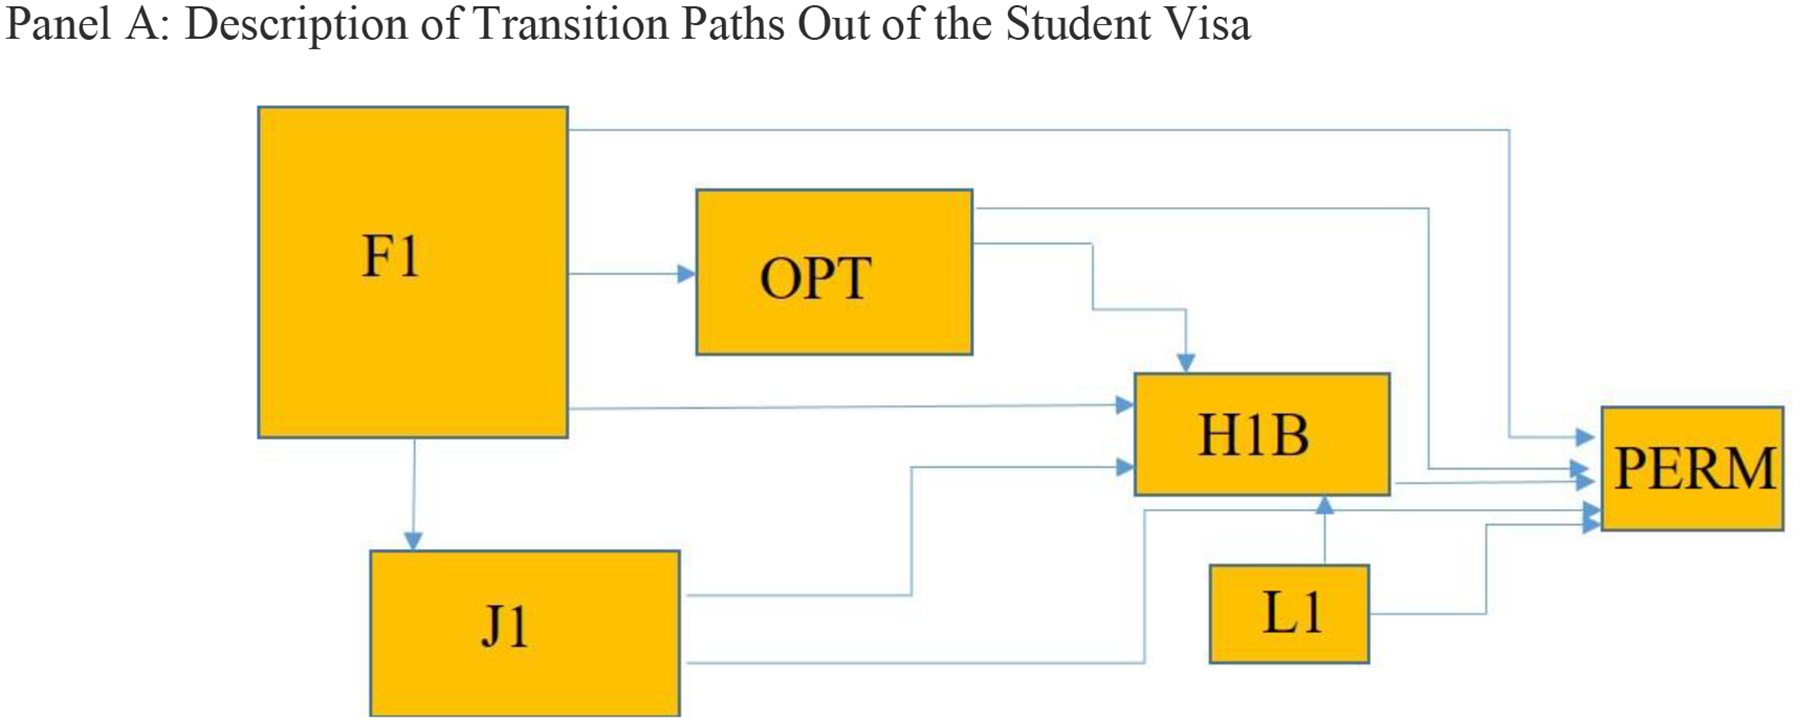
Transitions from Student to Work Visas
Notes: The diagram describes transition rates across types of visas. The F-1 visa is the student visa applicable to most students. The OPT is the Optional Practical Training that allows those on an F-1 visa to work for a U.S. based employer post graduation. The J-1 is the exchange researcher visa (also used by international medical graduates for medical residencies). The H-1B is the high-skill work visa. The L-1 is a high-skill visa for intra-firm executive transfers. PERM are applications for immigration status (green cards). The sizes of the boxes crudely, but not accurately, depict the size of the visas granted..
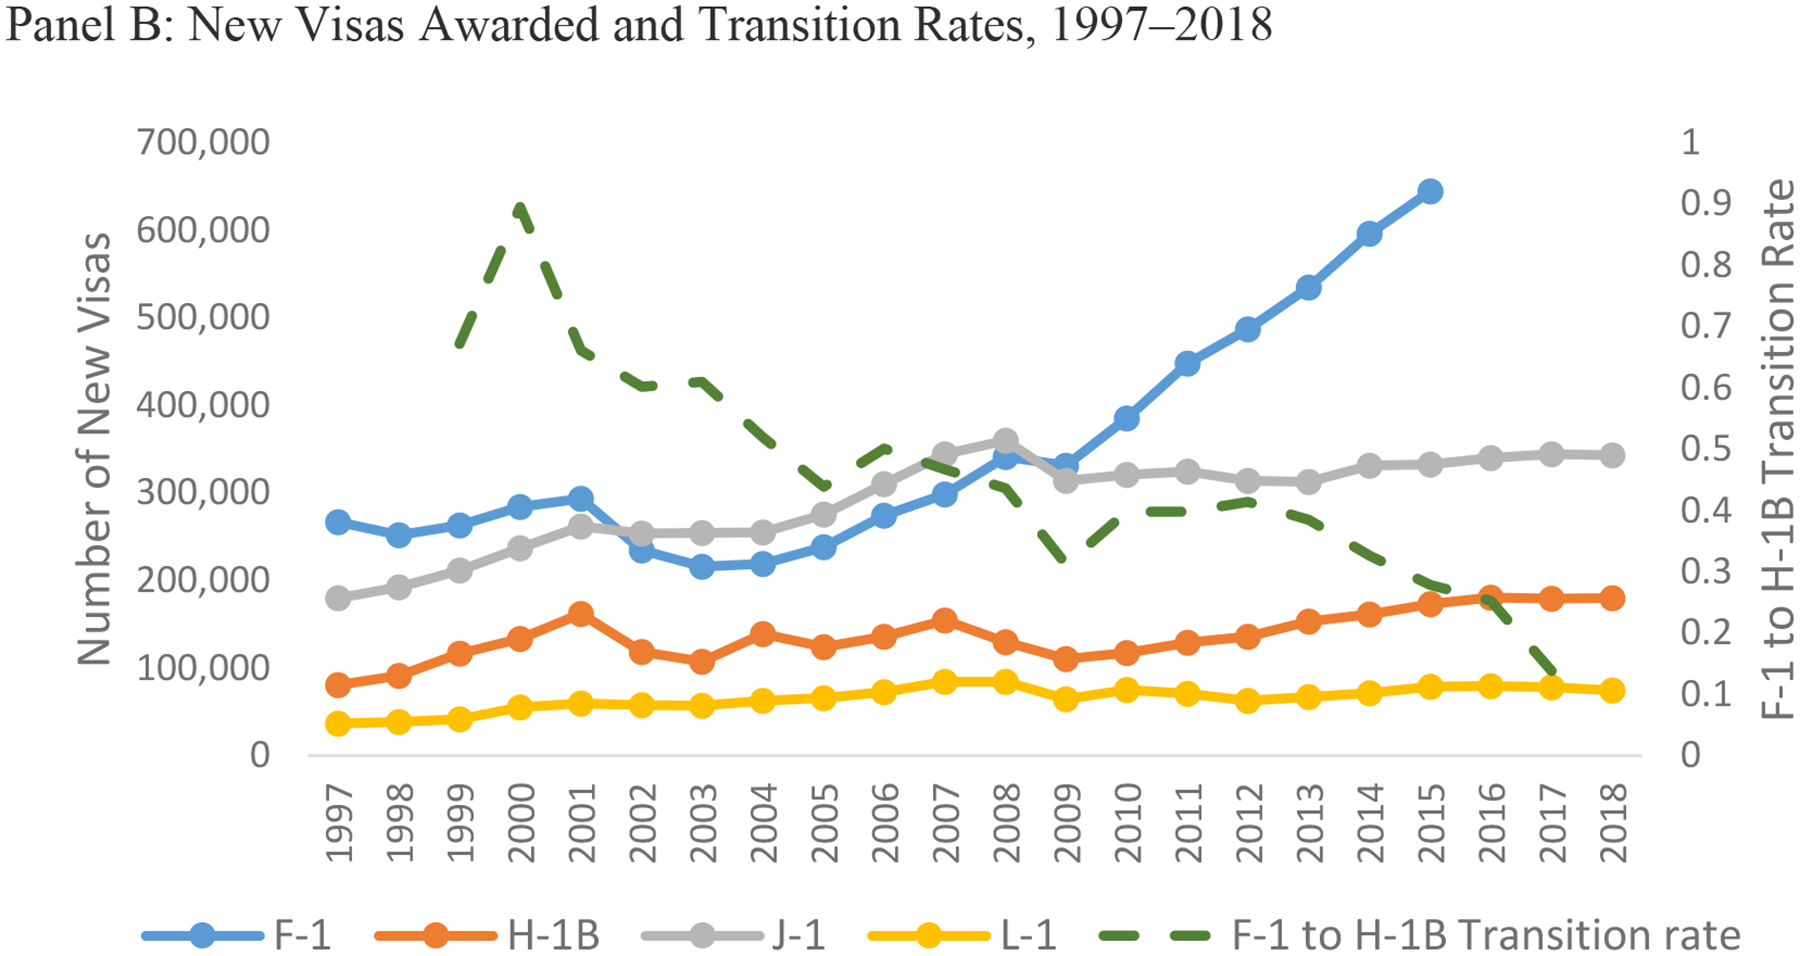
Source: Department of State (1997–2015F-1 visas are issues to full-time students at certified U.S. universities. The J-1 visa is for exchange students, researchers, and physicians undergoing training. The L-1 visa is for intra-company transfers of executives and managers. The H-1B visa is for high-skill workers in specialty occupations. The right-axis measures the green dotted line, where we use USCIS data to estimate the fraction of F-1 visas that converted to a (new, initial employment) H-1B visa each year. For the transition rates we use the 2000–18 Characteristics of H-1B Specialty Workers Reports of the USCIS, and 1999–2018 Completion Surveys by Race of the Integrated Post-Secondary Data System. The ratio of initial H-1B petitions processed to aliens in the U.S. to the number of foreign graduates of U.S. universities in that class of graduation is an approximation of the transition rate from F visas to H-1B for each year of graduation. We omit the F1 visa data after 2015 because of the change of visa regime in visa renewals for Chinese students.