
Figure 7—
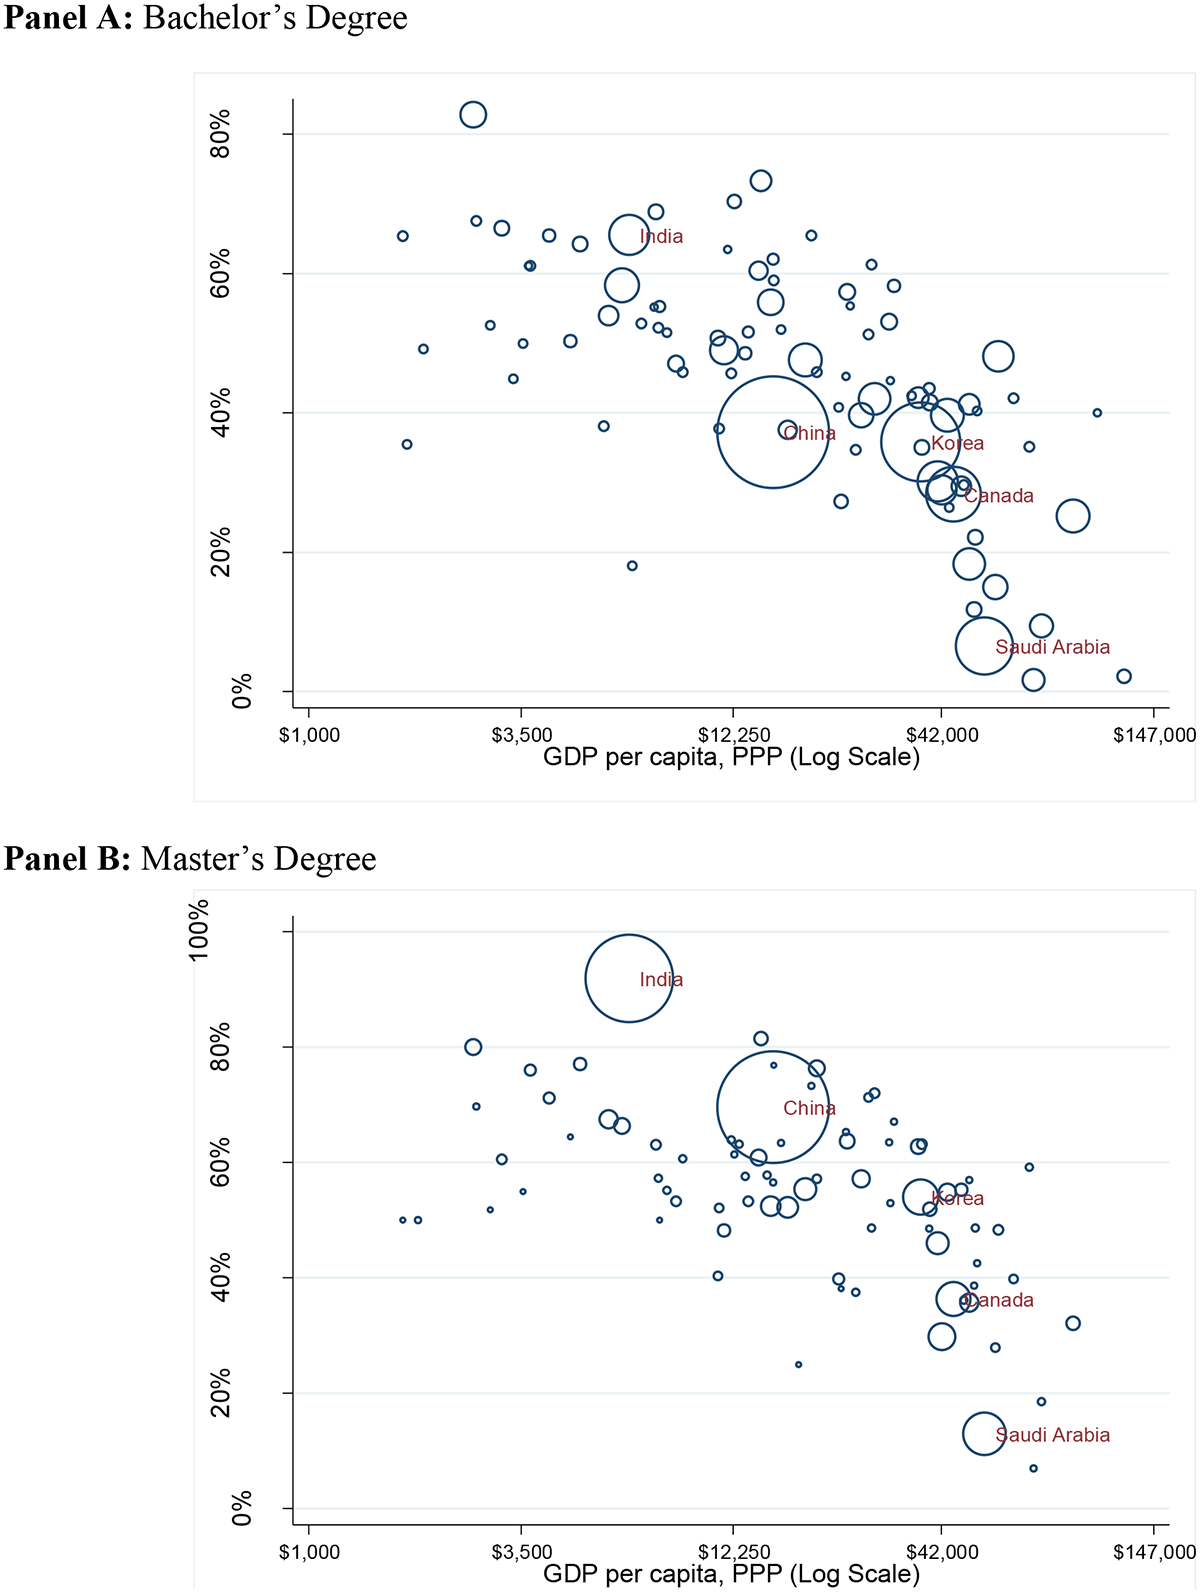
Share of F1 Visas Converted to OPT by Country’s per Capita GDP
Note: Size of each bubble is proportional to the number of foreign graduates in 2015. Sample is restricted to countries with more than 50 graduates in 2015. Source: F1 Data 2015 and World Bank 2016.