
Figure 9—
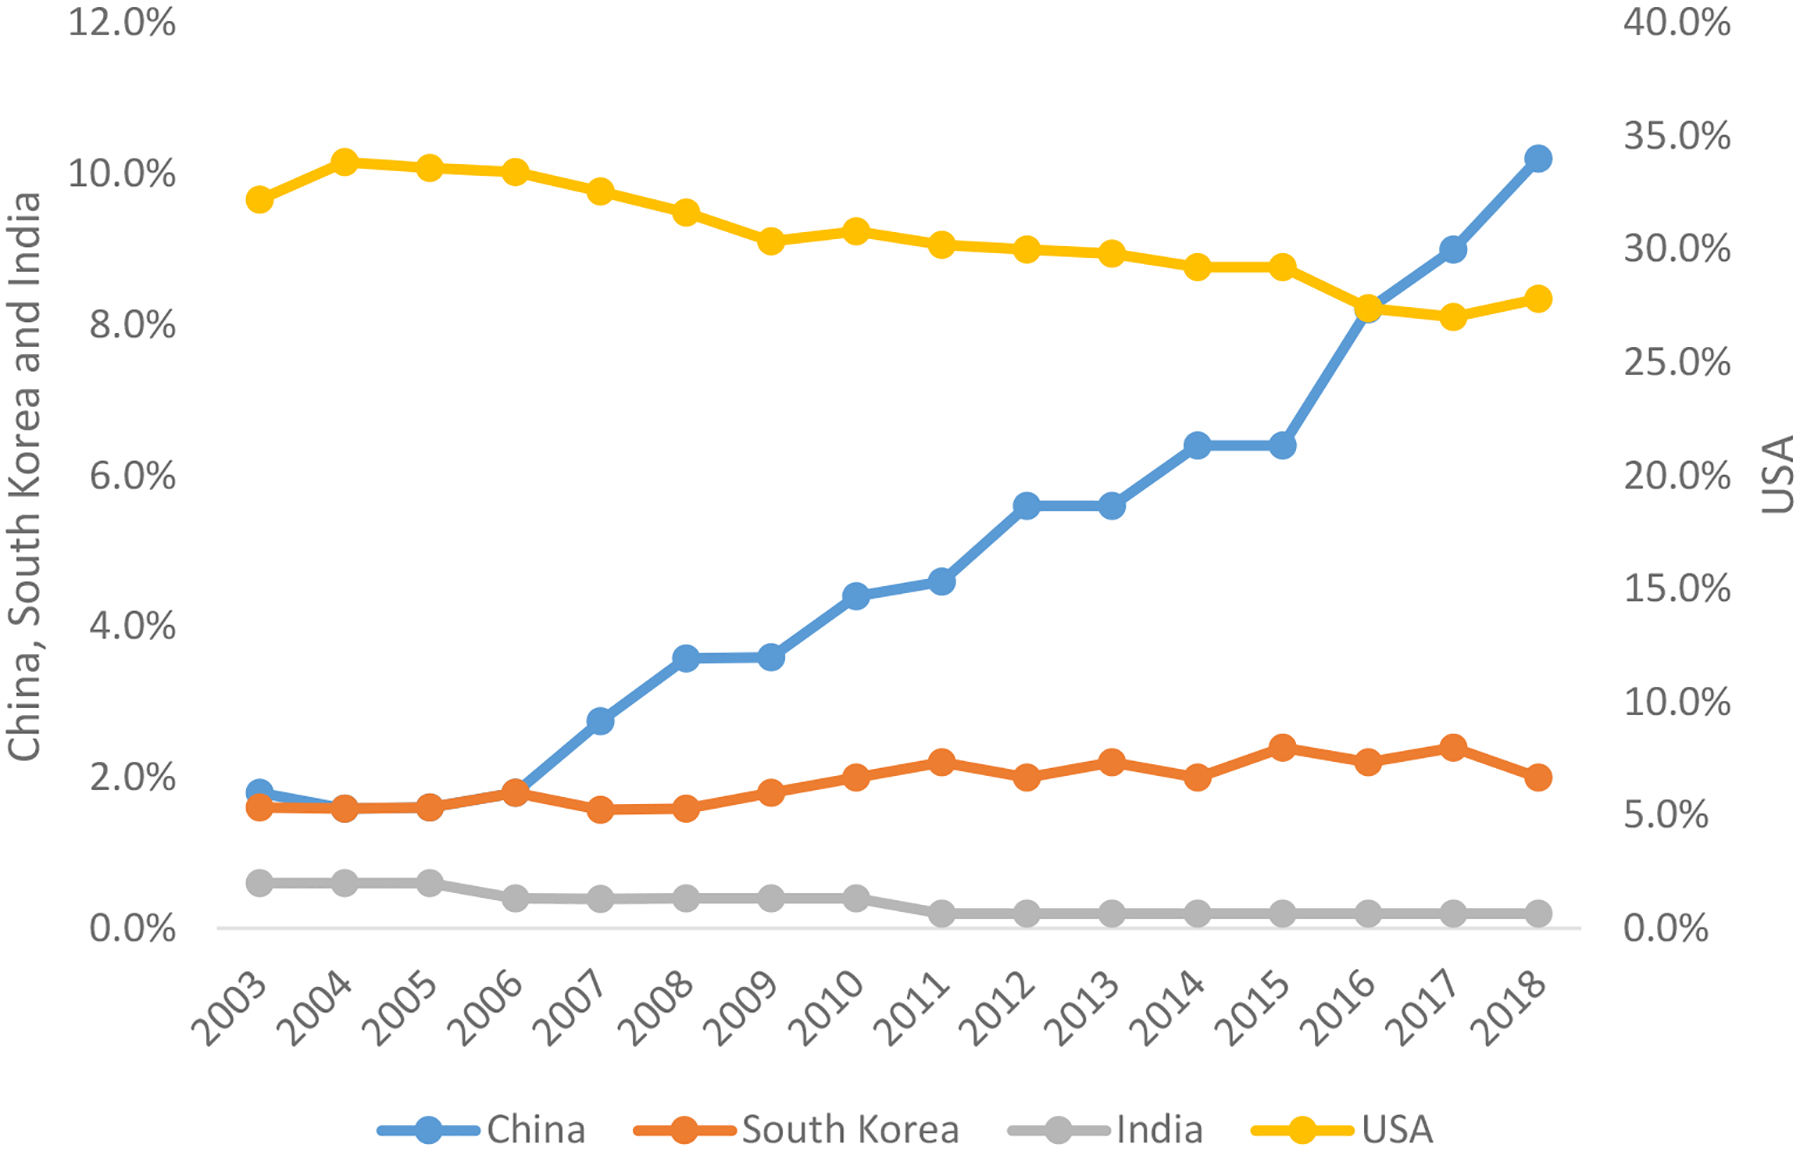
Share of Universities among the Top 500 rank
Note: The graph shows the share of universities among the 500 top ranked research universities according to the Shanghai’s Academic Ranking of World Universities (ARWU). Left y-axis is for China, South Korea, and India Universities. Right y-axis is for American Universities. Source: Shanghai Ranking, 2003–18.