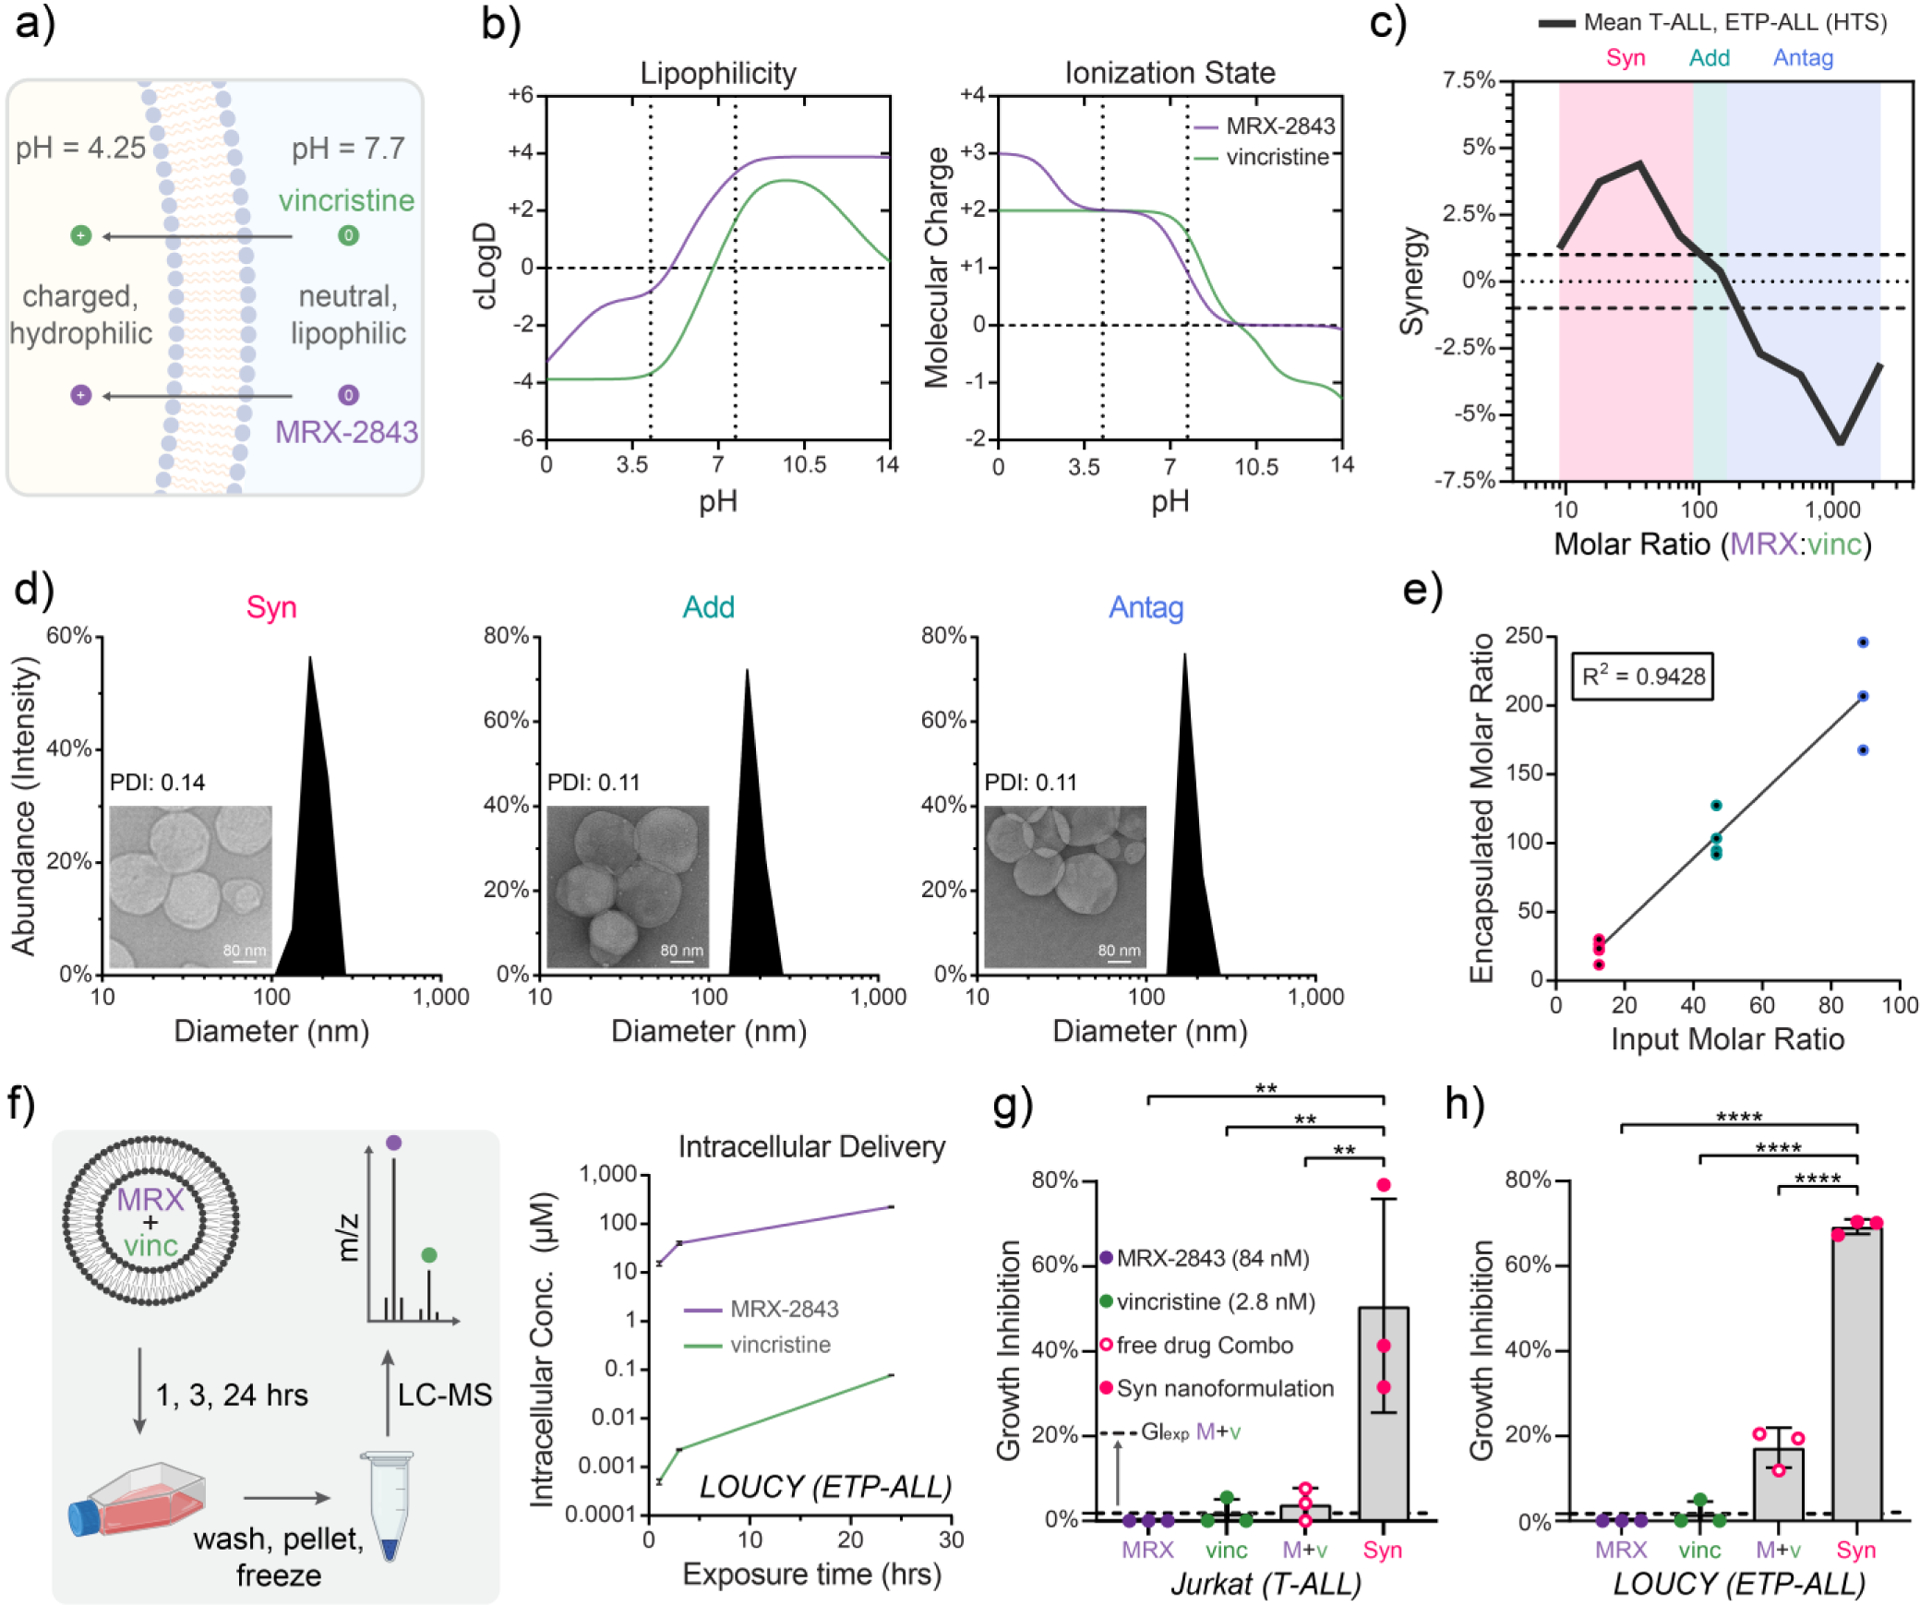
Figure 3. Lipid nanoparticles co-encapsulating MRX-2843 and vincristine constitutively maintain defined drug ratios following co-formulation and intracellular delivery.

a) Illustration of a pH gradient-based method of drug co-loading that relies upon (b) pH-dependent MRX-2843 and vincristine lipophilicity and charge. c) A plot of mean drug synergy versus MRX-2843:vincristine mole ratio defines synergistic (8.9 – 90), additive (90 – 160), and antagonistic (≥160) drug ratios. d) T-ALL tailored combination drug formulations encapsulating synergistic (Syn), additive (Add), and antagonistic (Antag) drug ratios shown at nanometer-scale size and uniformity as measured by dynamic light scattering and (inset) transmission electron microscopy e) Drug co-loading as measured by LC-MS. f) Intracellular drug delivery kinetics following treatment of LOUCY (ETP-ALL) cells with Antag nanoparticles over 24 h as measured by LC-MS. g) Comparison of growth inhibition following treatment with Syn nanoparticles, as well as combined and free MRX-2843/vincristine demonstrates that nanoparticle encapsulation further enhances in vitro drug synergy as measured by luminescent cell viability assay in Jurkat (T-ALL) cells (72 h) and (h) LOUCY (ETP-ALL) (72 h). (c) The line traces the trend in mean response between tested ratios, and hashes delineate the range of +/− 1% synergy, which we define as additivity. (d) Scale bars measure 80 nm, and PDI stands for polydispersity index. (e) Data points represent drug ratios from distinct nanoparticles batches as measured by LC-MS. Best fit by linear regression is shown with coefficient of linearity. (f) Vertices are mean values ± SD of intracellular drug concentrations of 3 replicates per time point as measured by LC-MS. (g,h) Individual values (dots) and mean values ± SD of 3 replicates from a single experiment are shown, where the dashed line represents the expected effect for an additive interaction (GIexp). Mean differences were evaluated by one-way ANOVA with Tukey’s correction for multiple comparisons, where * p<0.05, ** p<0.01, *** p<0.001, **** p<0.0001.
