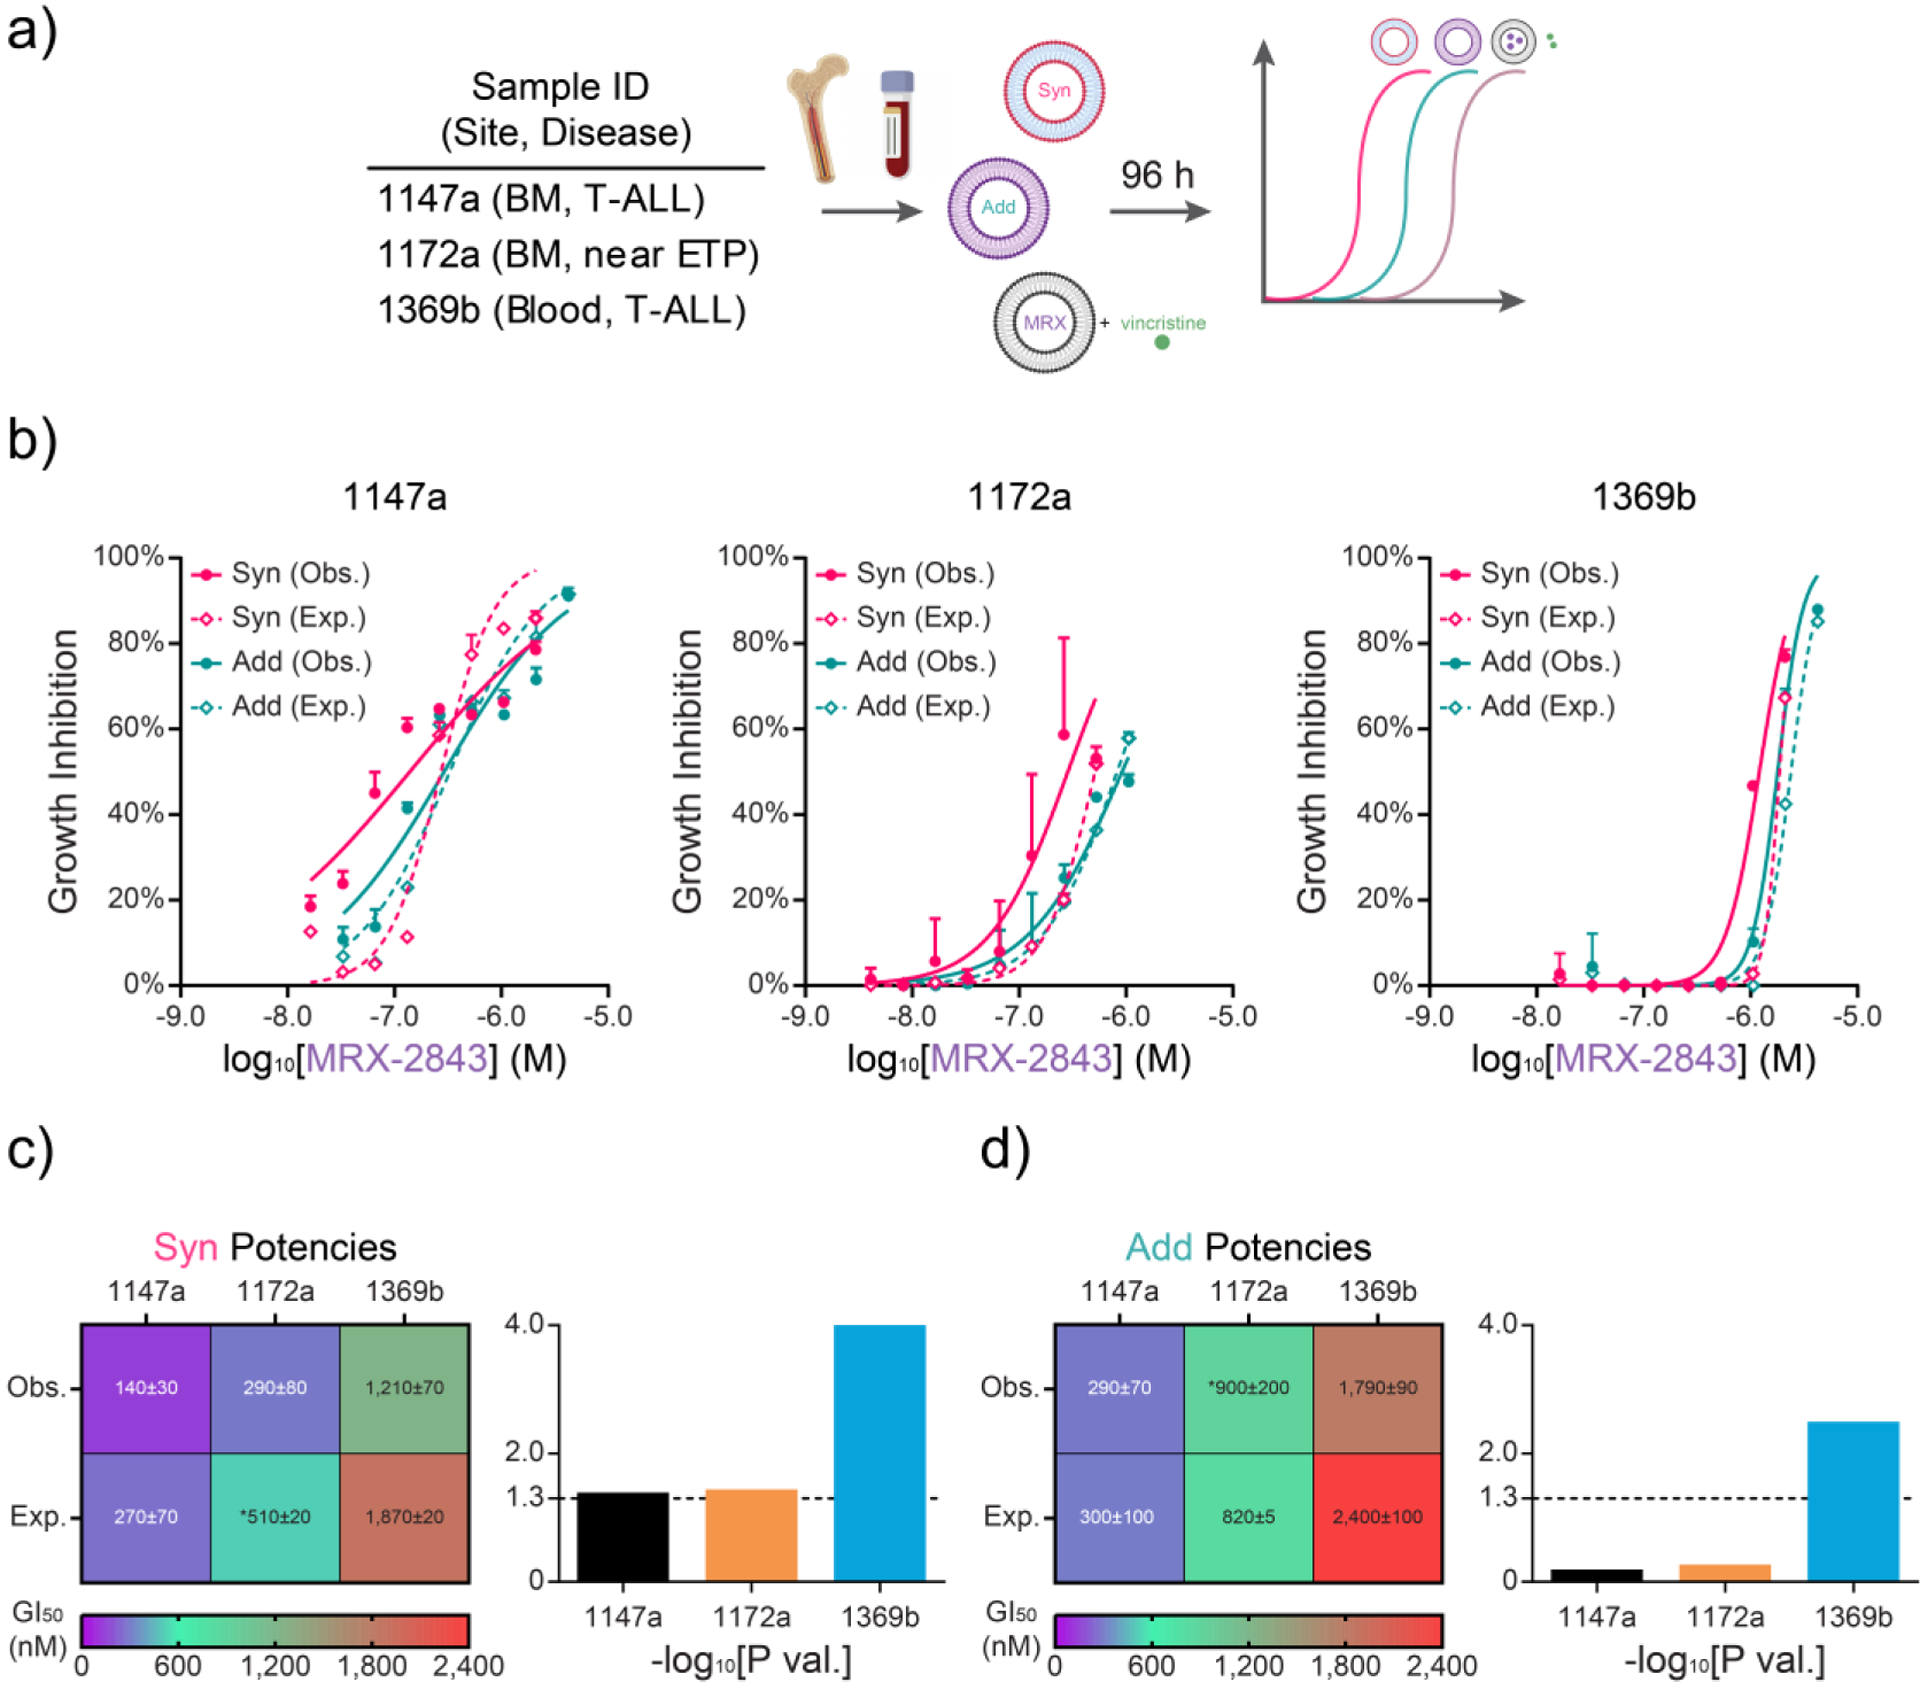
Figure 4. Comparative potency of ratiometric drug formulations in primary T-ALL samples ex vivo.

a) Approach to testing ratiometric nanoformulations in T-ALL or near ETP-ALL samples obtained from patient blood or bone marrow (BM) at initial diagnosis. b) Expected (Exp.; dashed) and observed (Obs.; solid) dose-dependent growth inhibition from synergistic and additive ratiometric drug formulations as measured by luminescent viability assay (96 h). c) Heatmap of GI50s and P values from (c) Syn and (d) Add drug formulations shown in (b). (b) Mean values ± SD of growth inhibition scaled against the concomitant MRX-2843 doses in the nanoparticles. Exp. dose response curves in (b) were calculated with the Bliss Independence model of drug synergy between single-agent liposomal MRX and vincristine free drug dose responses. (c,d) Heatmaps show GI50 ± standard error (nM) of Syn and Add potencies scaled by MRX-2843 dose. Bar charts show associated log transformed P values of unpaired parametric t tests. Asterisks (*) denote extrapolated GI50 values. All Obs. dose responses were run in triplicate, while Exp. dose responses were run either in duplicate (1172a) or triplicate (1147a, 1369b) in a single experiment.
