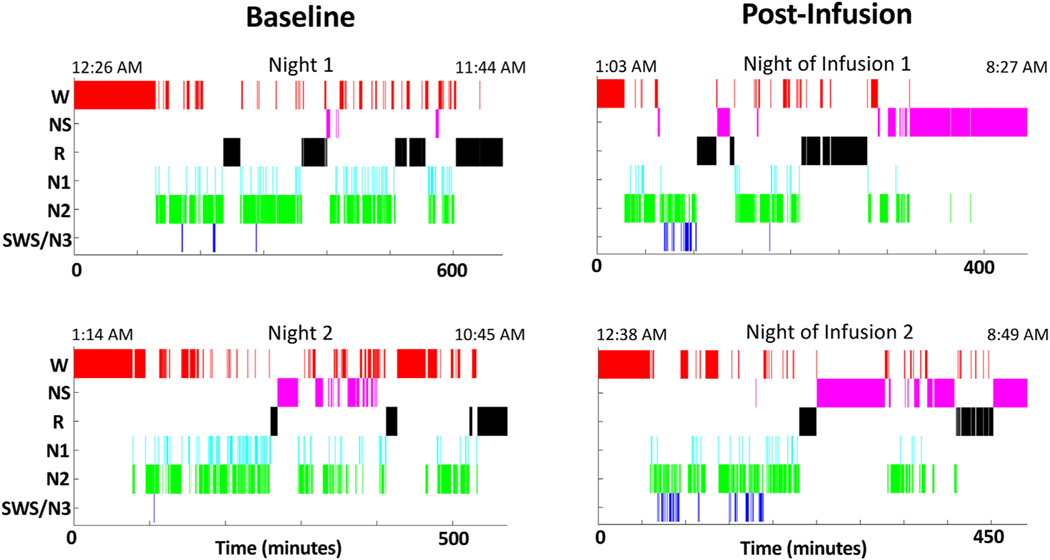
FIGURE 2.
Hypnograms were generated from sleep electroencephalographic (EEG) data recorded by a 71-year-old woman with treatment-resistant depression. The patient provided EEG recordings before and after receiving propofol infusions. Both baseline sleep recordings were conducted prior to Infusion 1. Sleep onset occurred at 2:35 A.M. and 2:48 A.M., respectively, for the first and second preinfusion nights. Postinfusion EEG recordings were conducted on the night following each morning propofol infusion. Sleep onset occurred at 1:31 A.M. and 1:37 A.M., respectively, for the first and second postinfusion nights. After each infusion, the patient exhibited slow wave sleep enhancement and earlier sleep onset compared to baseline. W = awake, NS = nonscorable epochs, R = rapid eye movement (REM) sleep, N1 = non-REM stage 1 sleep, N2 = non-REM stage 2 sleep, N3 = non-REM stage 3 sleep, SWS = slow wave sleep.

