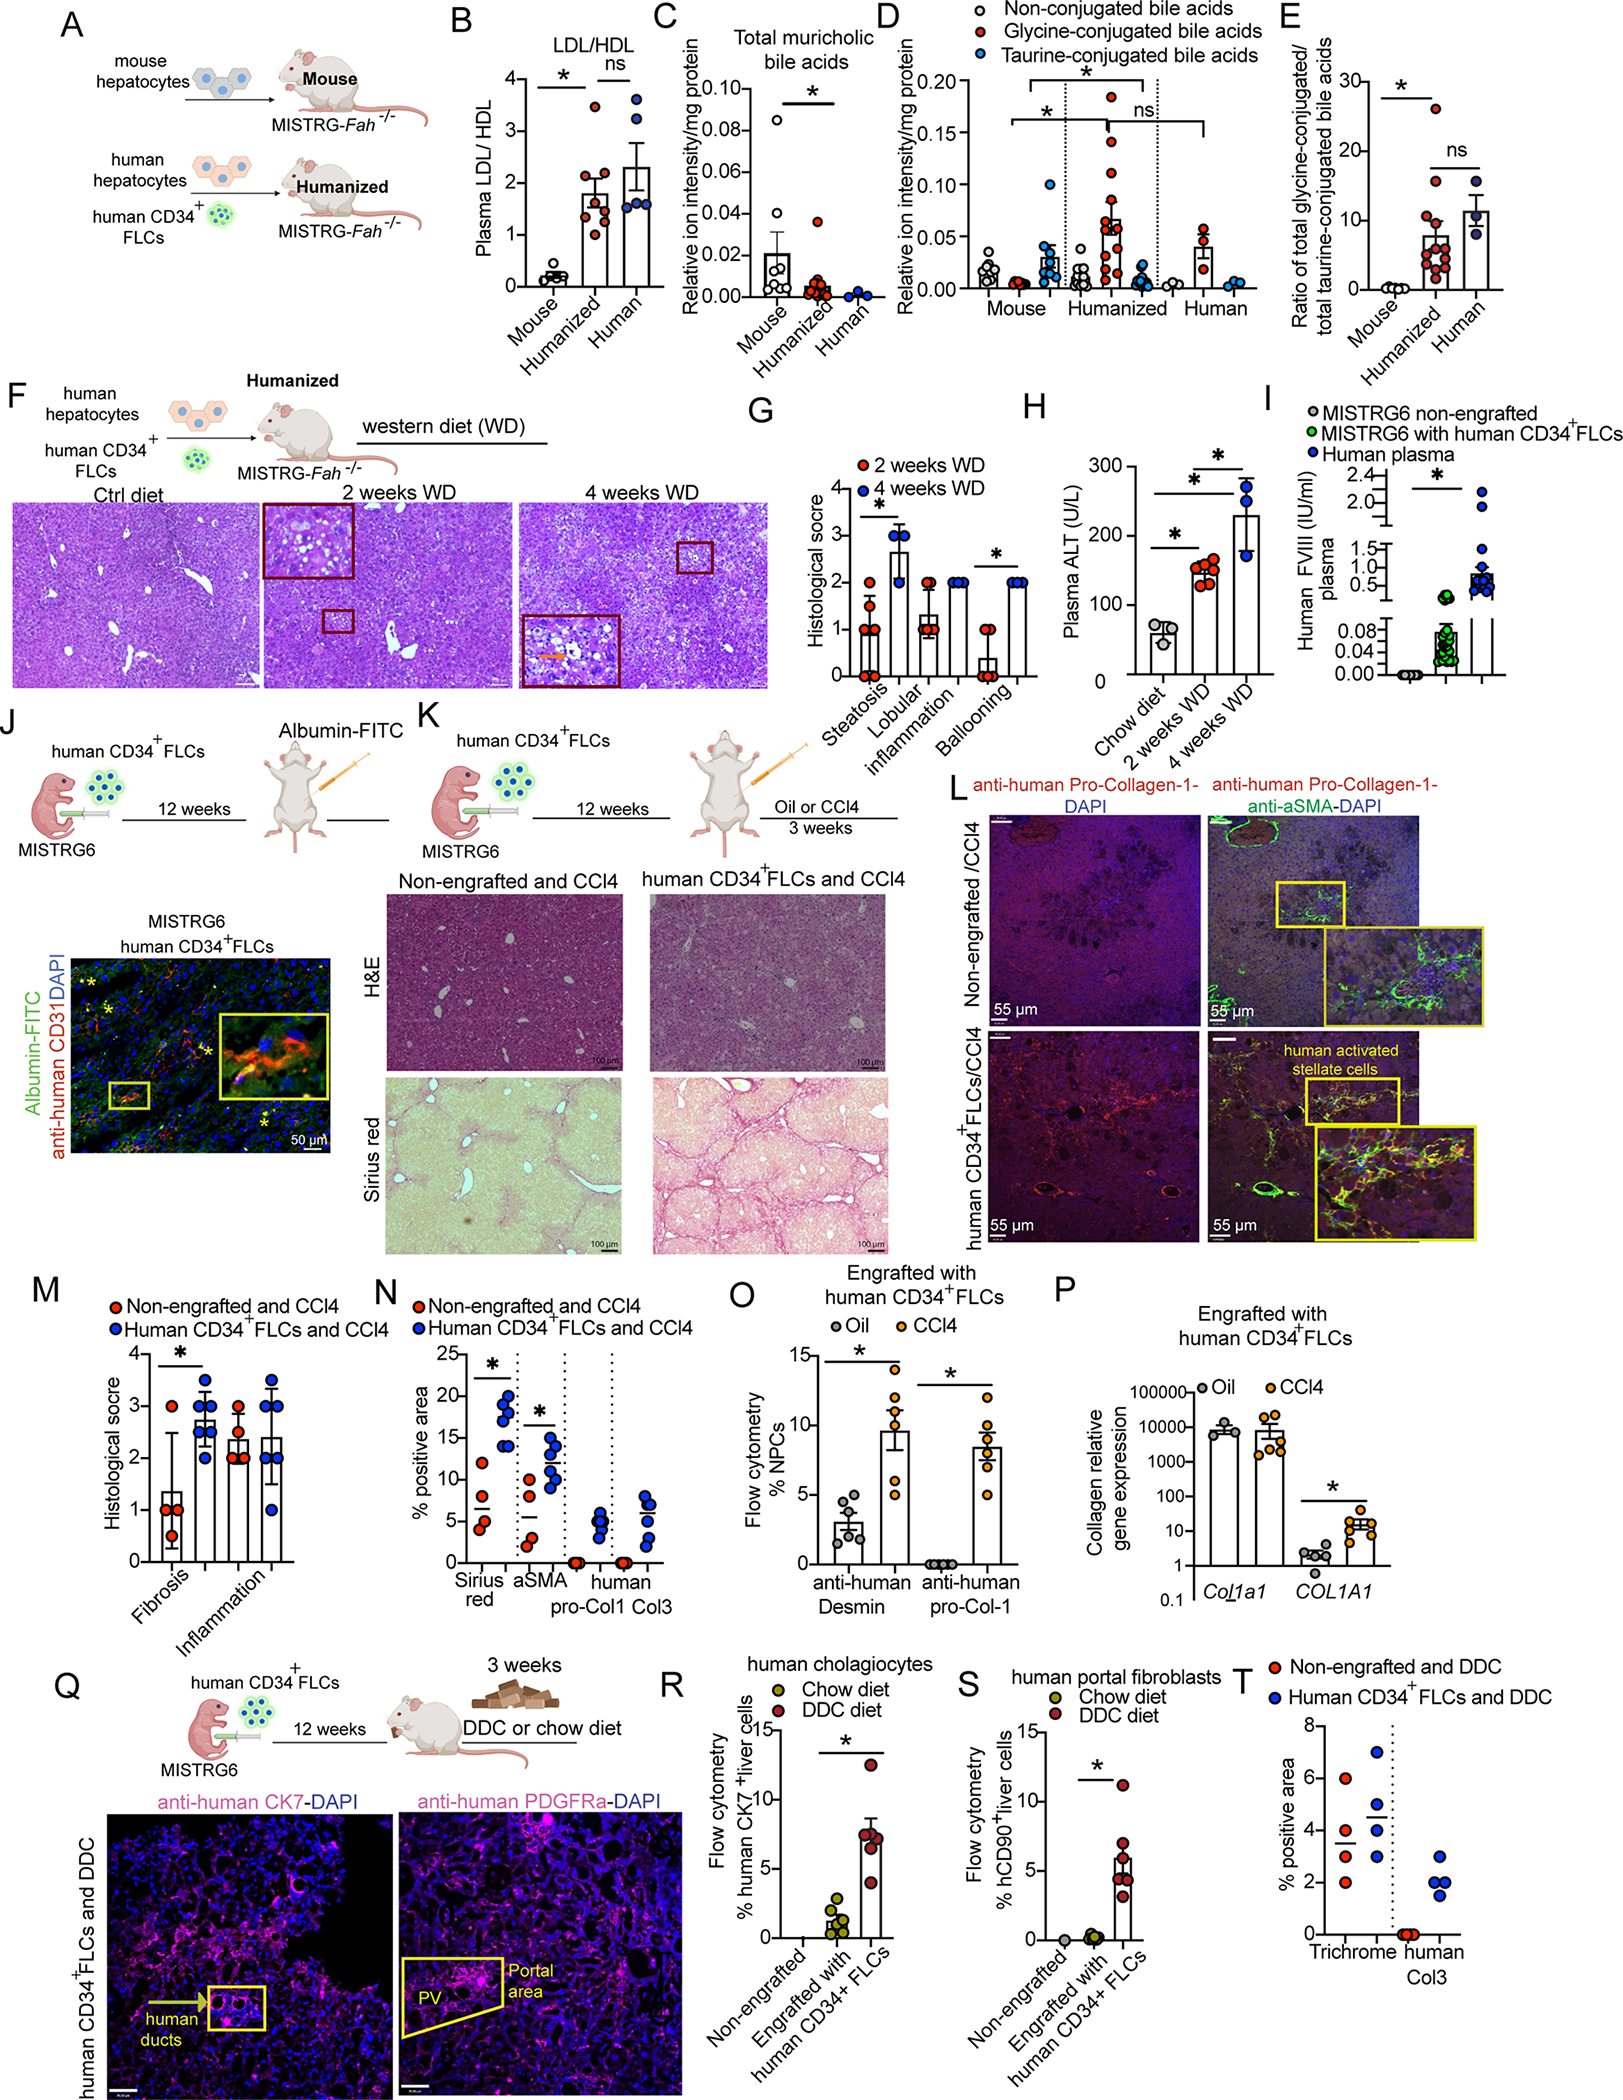
Figure 3. Human liver cells possess key cell type-specific functional capacities in vivo.

(A) Adult MISTRG-Fah−/− mice were engrafted with human CD34+ FLCs and human hepatocytes (humanized mouse) or murine FAH-WT hepatocytes only (mouse).
(B) Plasma LDL/HDL cholesterol ratio.
(C-E) Bile acids in the hepatocyte fraction measured with HPLC-MS/MS.
(F-G) H&E and histological score in humanized MISTRG-Fah−/− mice fed with a western diet or standard chow diet for 2 or 4 weeks. Orange arrow shows ballooning.
(H) Plasma ALT levels.
(I) Human Factor VIII in the plasma of MISTRG6 mice and healthy volunteers.
(J) Uptake of an FITC-albumin conjugate (green) by human endothelial cells (CD31+, in red) in the liver of humanized MISTRG6 mice. Yellow asterisks indicate areas of colocalization. The cropped images in yellow rectangles show areas of colocalization at a higher magnification.
(K, M) Induction of fibrosis by CCl4 in MISTRG6 mice engrafted with human CD34+ FLCs and non-engrafted controls. H&E and Sirius red staining and the respective histological score are shown.
(L) Immunofluorescence for aSMA (human and mouse, dual specificity, in green) and human pro-collagen-1 (in red). Yellow rectangles indicate human activated stellate cells in yellow.
(N) Quantification of Sirius red, human collagen-3 and human pro-collagen-1 positive area using Image-J.
(O) Quantification of human Desmin and human pro-collagen-1-expressing NPCs by flow cytometry.
(P) Gene expression of mouse Col1a1 and human COL1A1, quantitated by RT-qPCR.
(Q) Induction of ductular reaction in MISTRG6 mice engrafted with human CD34+ FLCs and non-engrafted controls. The mice were fed ad-libitum with 0.01% DDC or chow diet for 3 weeks. Immunofluorescence for human CK7 and human PDGFRa in purple.
(R, S) Quantification of human cholangiocytes (CK7+ cells) and human portal fibroblasts (CD45−CD90+ cells) in the liver by flow cytometry.
(T) Quantification of trichrome staining for total collagen and human collagen-3 positive area using Image-J.
All cartoons were made using BioRender. See also Figure S5. Each dot in the graphs is a biological replicate; n>3 biological replicates from 2 independent experiments. Data represent mean ± SEM. ns, non-significant; *p < 0.05.
