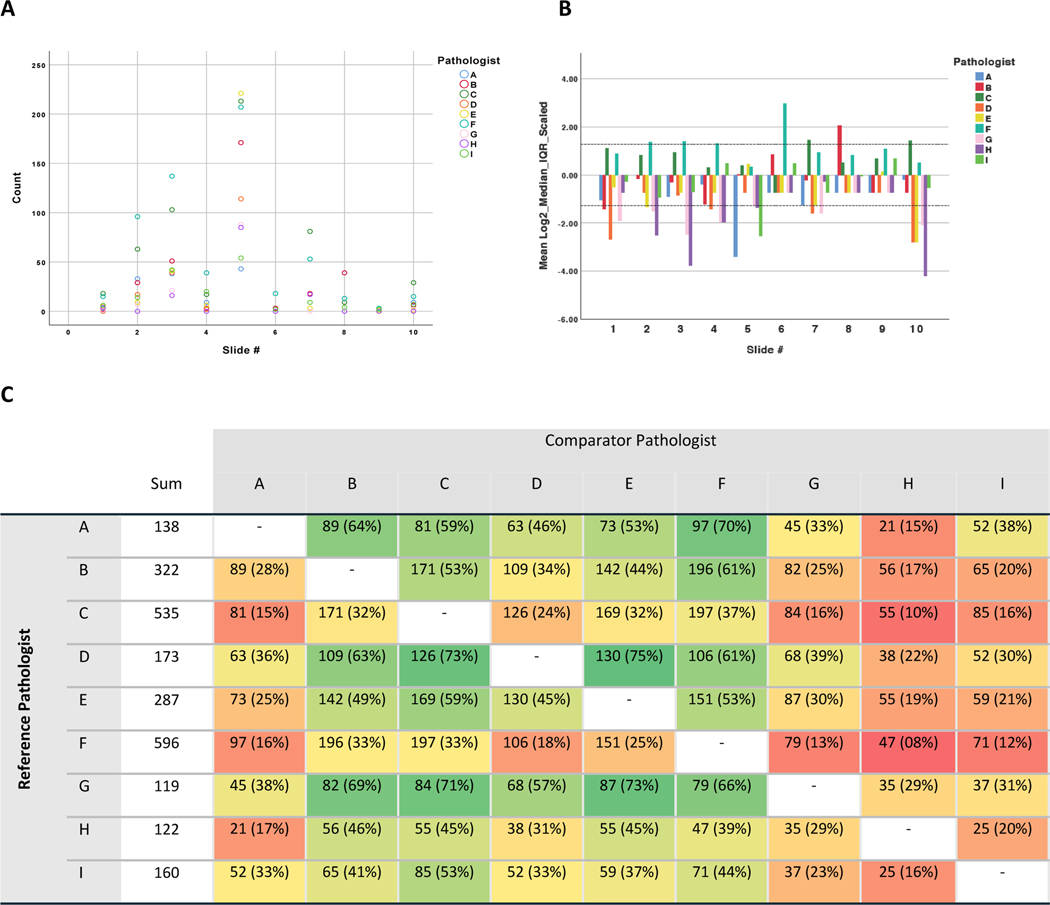
Figure 2.
A: Count of Cells Circled on Each Image by Pathologist. It is notable that in all but two images (#3 and #5), at least one pathologist reported no ballooned cells present. Zero ballooning was agreed on by two pathologists in two images (#4 and #7); five pathologists in two images (#8 and #9), and six pathologists in one (#6). All pathologists except two (F and I) recorded zero ballooning at least once. B: Scaled Count of Cells Circled by Slide and Pathologist demonstrating pathologist propensity to identify hepatocytes as ballooned. Pathologist F systematically reported greater numbers of ballooned cells than the majority of their peers, followed by C. In contrast, pathologists G, H, and D systematically reported less ballooning. C: Heatmap showing Pairwise Agreement in Cells Identified as Ballooned between Pathologists. Pairwise agreement in ‘ballooned cell’ call, n (%), where percentage refers to the proportion of cells identified as ballooned by the reference pathologist that were also identified by the comparator pathologist. Heatmap shaded to denote percentage interobserver agreement relative to the reference pathologist (green = high, red = low).

