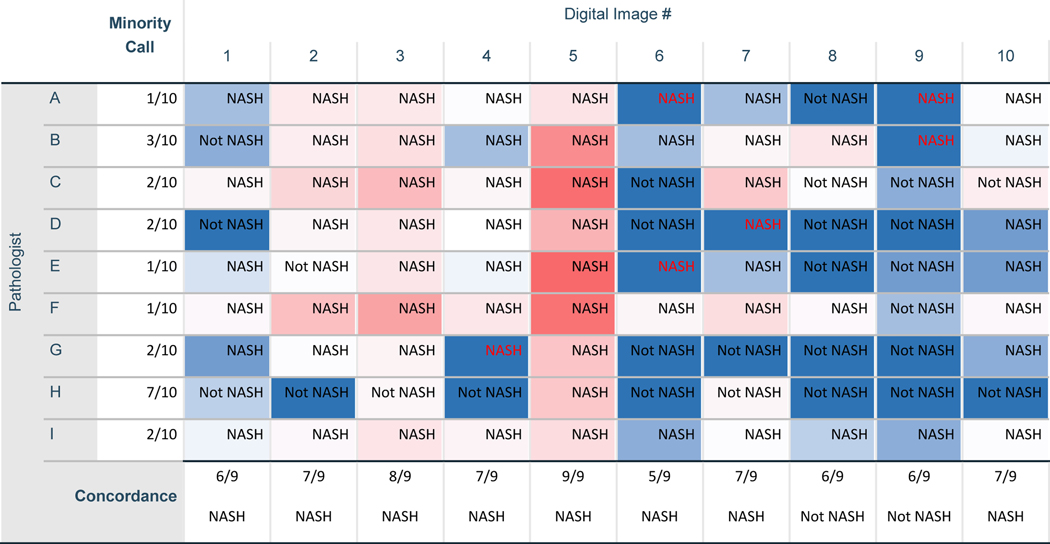
Figure 5.
Table cells are coloured Blue through to Red as a heat map indicating the relative number of Ballooned hepatocytes identified by each pathologist (dark blue denotes cases for which a given pathologist has indicated that no ballooned hepatocytes were present at Phase 1. Colour changes through light blue to white and then red as the number of ballooned cells identified increases, with darker red indicating that many ballooned cells were seen). The non-NASH NAFL vs NASH diagnosis at Phase 2 made independently by each pathologist is shown, along with the degree of concordance for this decision (as a fraction out of nine pathologists) and the majority decision for each digital image. Where NASH is shown in red text, this denotes a NASH diagnosis call by a pathologist at Phase 2 despite previously reporting that no Ballooned hepatocytes were present in the digital image during Phase 1.

