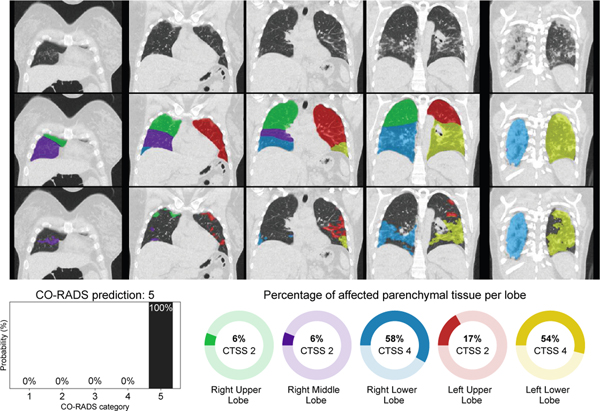
Fig. 3.
Example output of the CORADS-AI system for a COVID-19 case. Top row shows coronal slices, the second row shows lobe segmentation and bottom row shows detected abnormal areas of patchy ground-glass and consolidation typical for COVID-19 infection. The CO-RADS prediction and CT severity score per lobe are displayed below the images.

