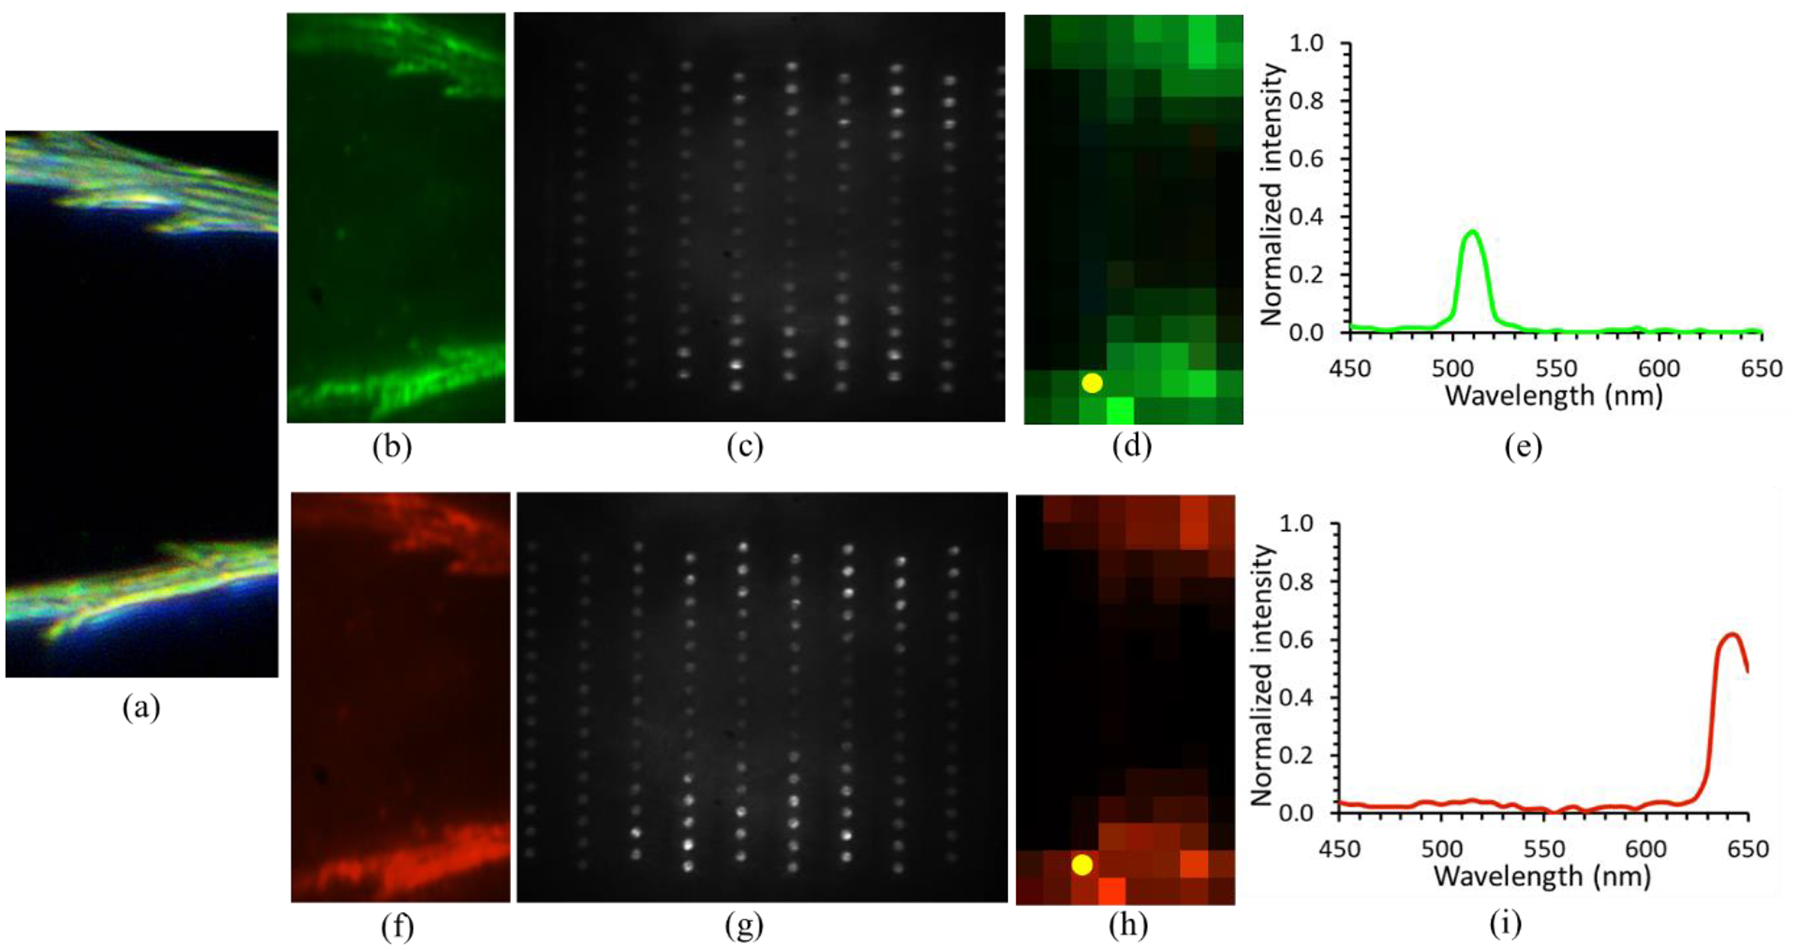
Figure 11.

Demonstration of the snapshot hyperspectral imaging capability using dandelion fuzz sample. (a) Color image of the sample under visible light illumination, (b) color image of the sample under 510nm spectrum, (c) the dispersed image, (d) the reconstructed color image, (f) color image of the sample under 640nm spectrum, (g) the dispersed image, (h) the reconstructed color image, (e) and (i) are the normalized intensities of the lightguide indicated by the yellow dot in (d) and (h). The intensity was normalized by the highest spectral intensity of the light guide. The video file demonstrates the real time hyperspectral imaging capability. All the spectrum profiles were normalized based on the maximum value within the 22 frames.
