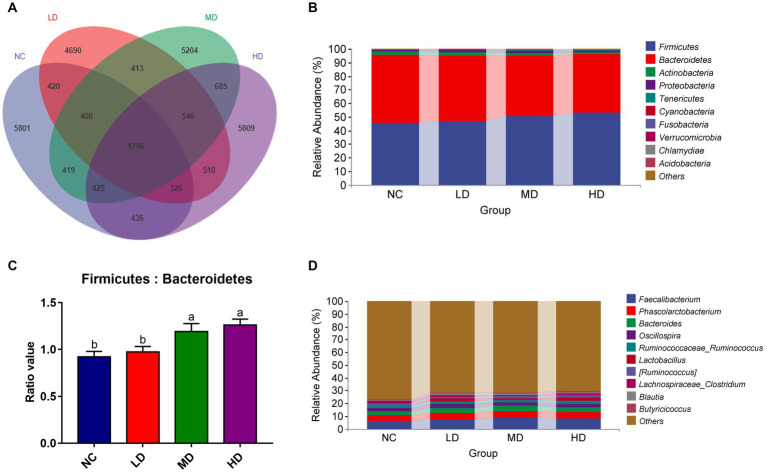
Figure 5.
Summary of the microbial communities in the cecal contents of broilers on day 70. (A) Venn diagram summarizing the numbers of common and unique ASVs in the microflora, (B) relative abundances of the top 10 bacterial phyla in each group, (C) the ratio of Firmicutes to Bacteroidetes, (D) relative abundances of the top 10 bacterial genera in each group. a,bMeans among groups without the same letter are significantly different (p < 0.05).

