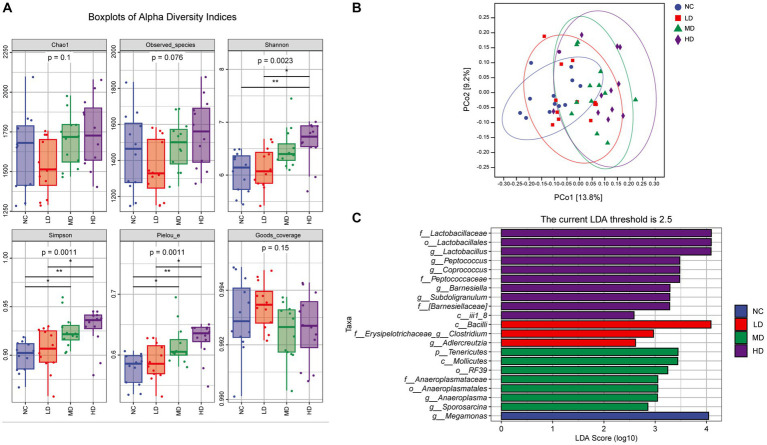
Figure 6.
The effects of DOL on cecal microbial community diversity of the broilers on day 70. (A) The alpha diversity indexes, (B) Principal coordinate analysis (PCoA) plot using Bray Curtis distance, (C) Histogram shows linear discriminant analysis (LDA) scores of taxa differentially abundant between different groups. Statistical analyses were performed using linear discriminant analysis effect size (LEfSe).

