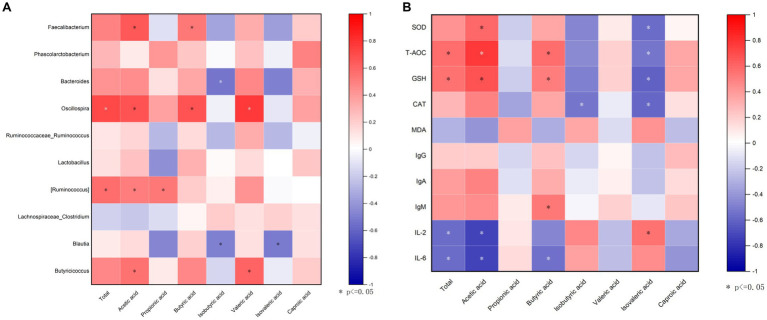
Figure 8.
Correlation analysis. (A) A correlogram showing association between cecal SCFAs concentrations and the top 15 abundant cecal microbial genera; (B) Heatmap of Spearman’s correlation between SCFAs and antioxidant capability, and immune indexes in the serum. The spearman’s correlation coefficient is denoted by the color of the heatmap, with red indicating a positive correlation and bule indicating a negative correlation. Color depth indicates the strength of correlation; the asterisk represents a statistically significant correlation (p < 0.05).

