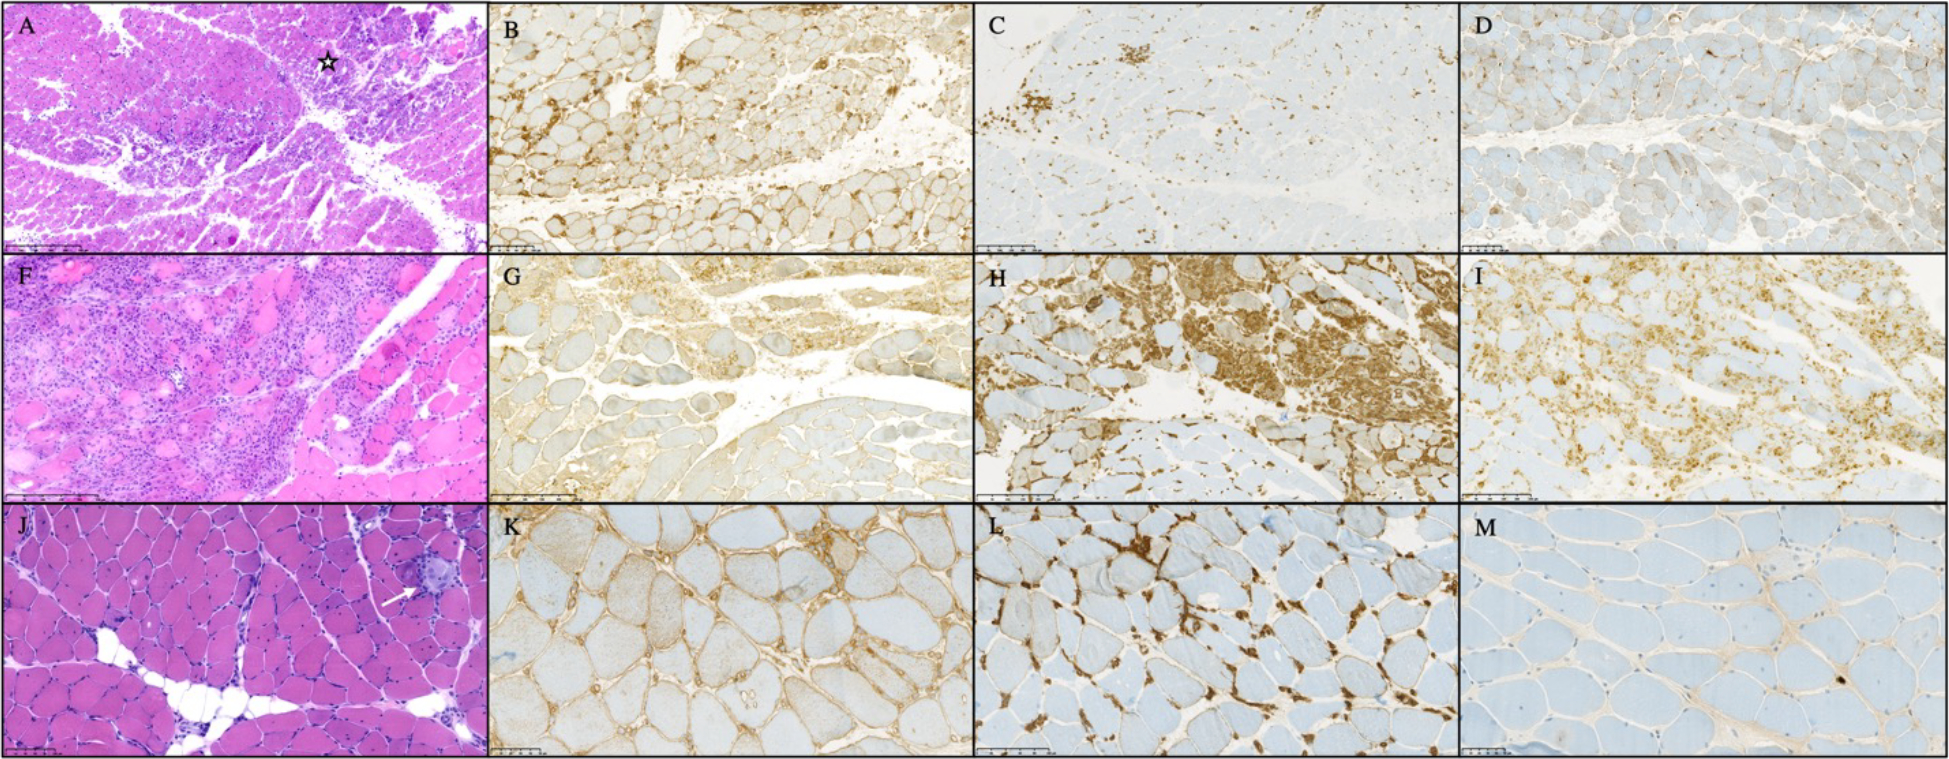
Figure 2.

Histological appearance of patients with immune-checkpoint induced myopathy from clusters ICI-DM (A-D), ICI-MYO1 (F-I), and ICI-MYO2 (J-M). ICI-DM biopsies showed perifascicular atrophy, and intense vascular damage (star marks an area of muscle infarction). ICI-MYO1 showed intense inflammatory infiltrates with abundant macrophages and T-cells. Finall, ICI-MYO2 had predominant necrosis (white arrow indicates an area of myophagocytosis) with few inflammatory cells. The first column shows H&E (A, F, J), the second MHC-1 (B, G, K), the third MHC-2 (C, H, L). The fourth column shows CD68 in I and MX1 in D and M.
