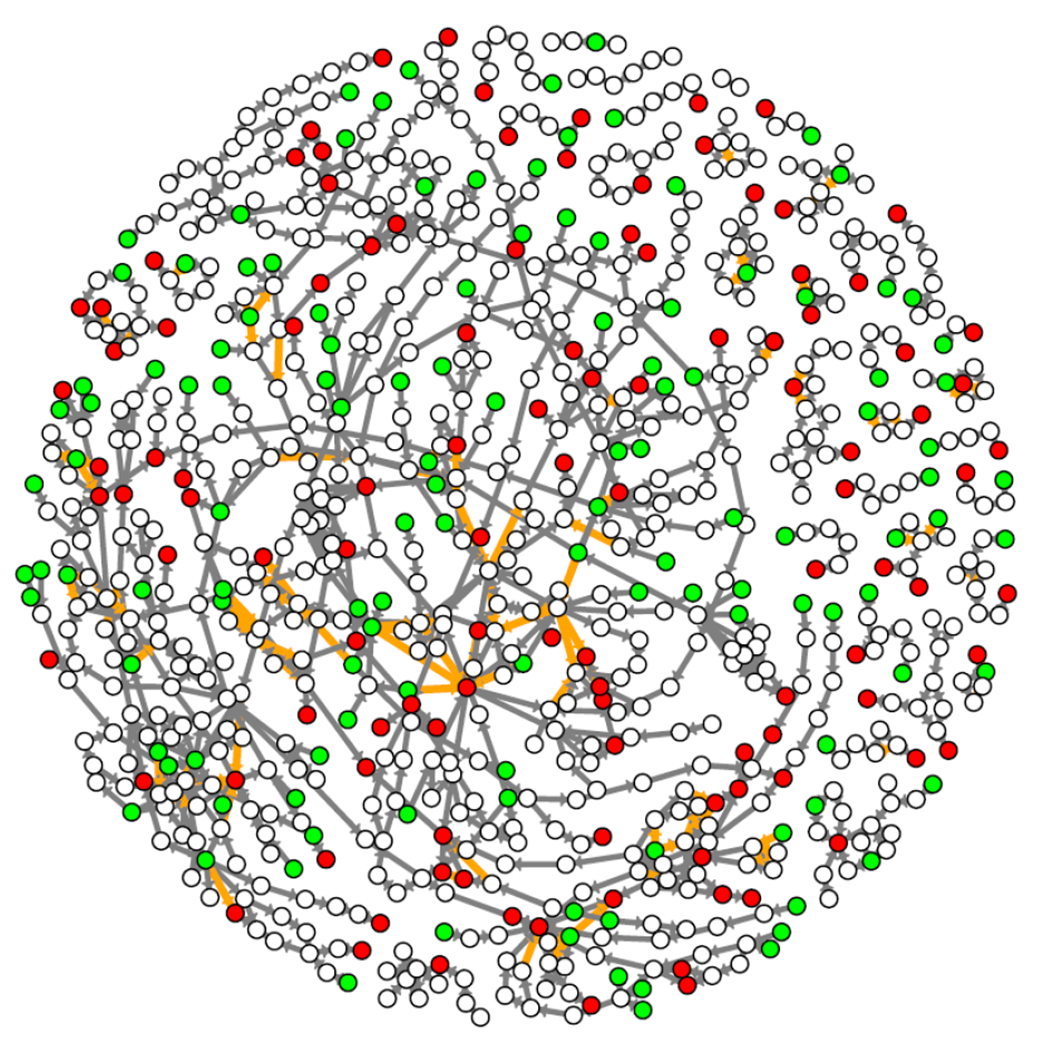
Figure 2:

All AOPs in the AOP-KB were assembled into a network. Key events (KEs) are represented as circular nodes. Molecular Initiating Events (MIEs) and Adverse Outcomes (AOs) are two specialized KEs represented as green and red nodes, respectively. Key event relationships (KERs) are represented as directed edges between nodes. Non-adjacent KERs are represented as orange edges.
