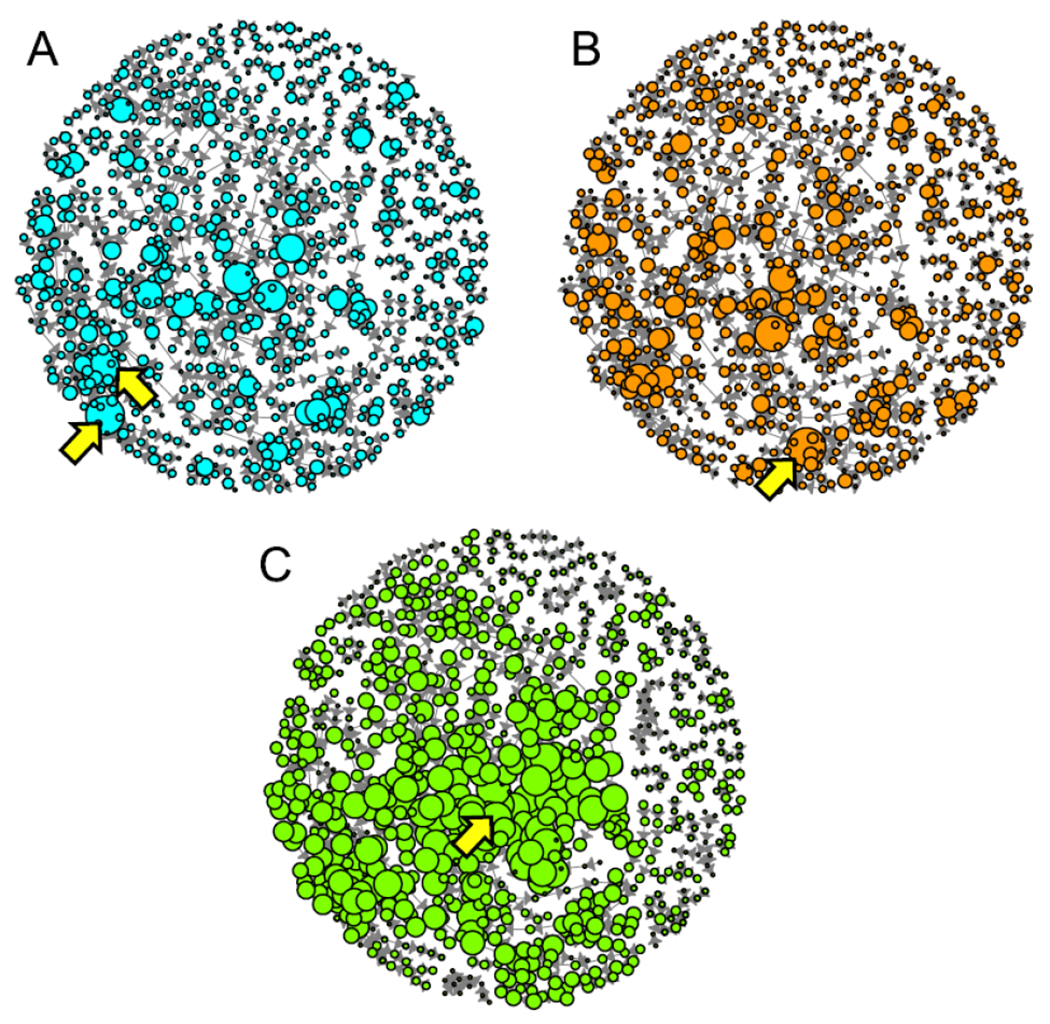
Figure 5:

The size of the KE nodes in the AOP-KB are scaled to various measures of network connectivity and the KEs with the greatest values are indicated by arrows. A) KE nodes are scaled to degree-out. The KEs with the greatest degree-out were AhR activation and LxR activation; B) KE nodes are scaled to degree-in. The KE with the greatest degree-in was increased mortality; and C) KE nodes were scaled to the log of AOP occurrence. The KE with the greatest AOP occurrence was impaired learning and memory.
