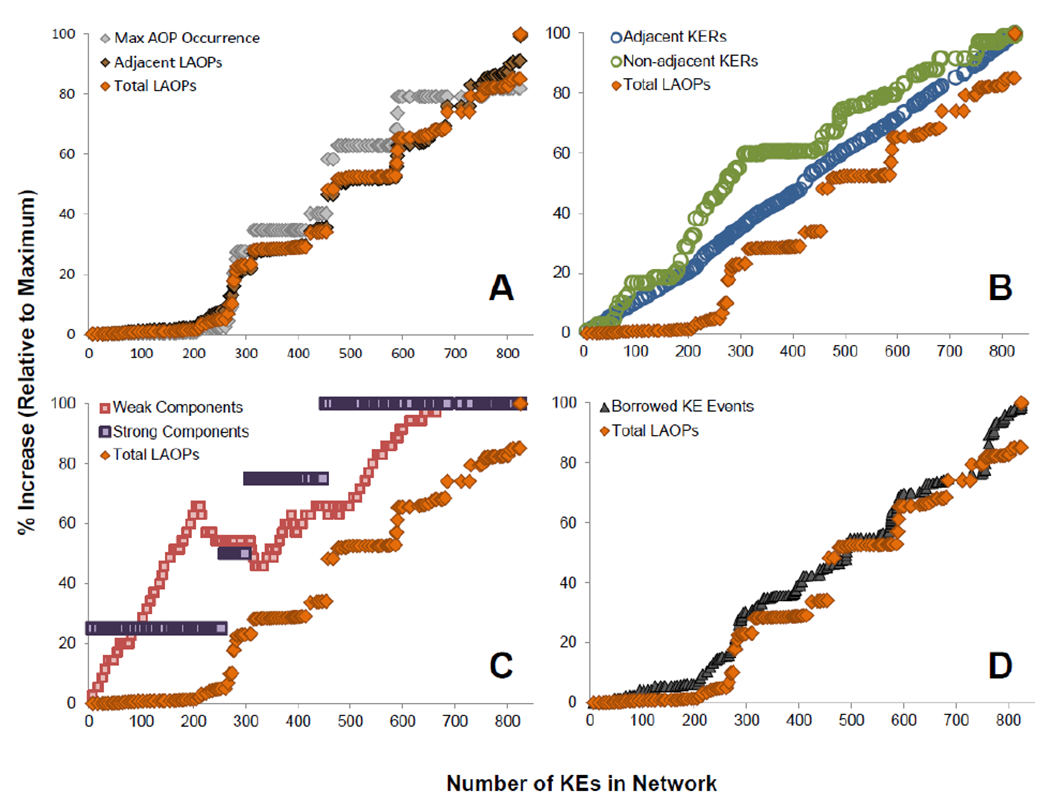
Figure 7:

The growth of the AOP-KB was simulated by rebuilding the network one user-defined AOP at a time. After each user-defined AOP was added to the network, various statistics were determined and compared to the rate of emergence of linear AOPs (LAOPs). A) The rate of total LAOP emergence is compared to emergence of LAOPs that only contain adjacent KERs, and to the maximum AOP occurrence value in the network; B) total LAOPs are compared to the number of adjacent and non-adjacent KERs; C) total LAOPs are compared to the number of weakly and strongly connected components in the network, and; D) total LAOPs are compared the rate at which new user-defined AOPs are built by borrowing KEs that already exist in the network.
