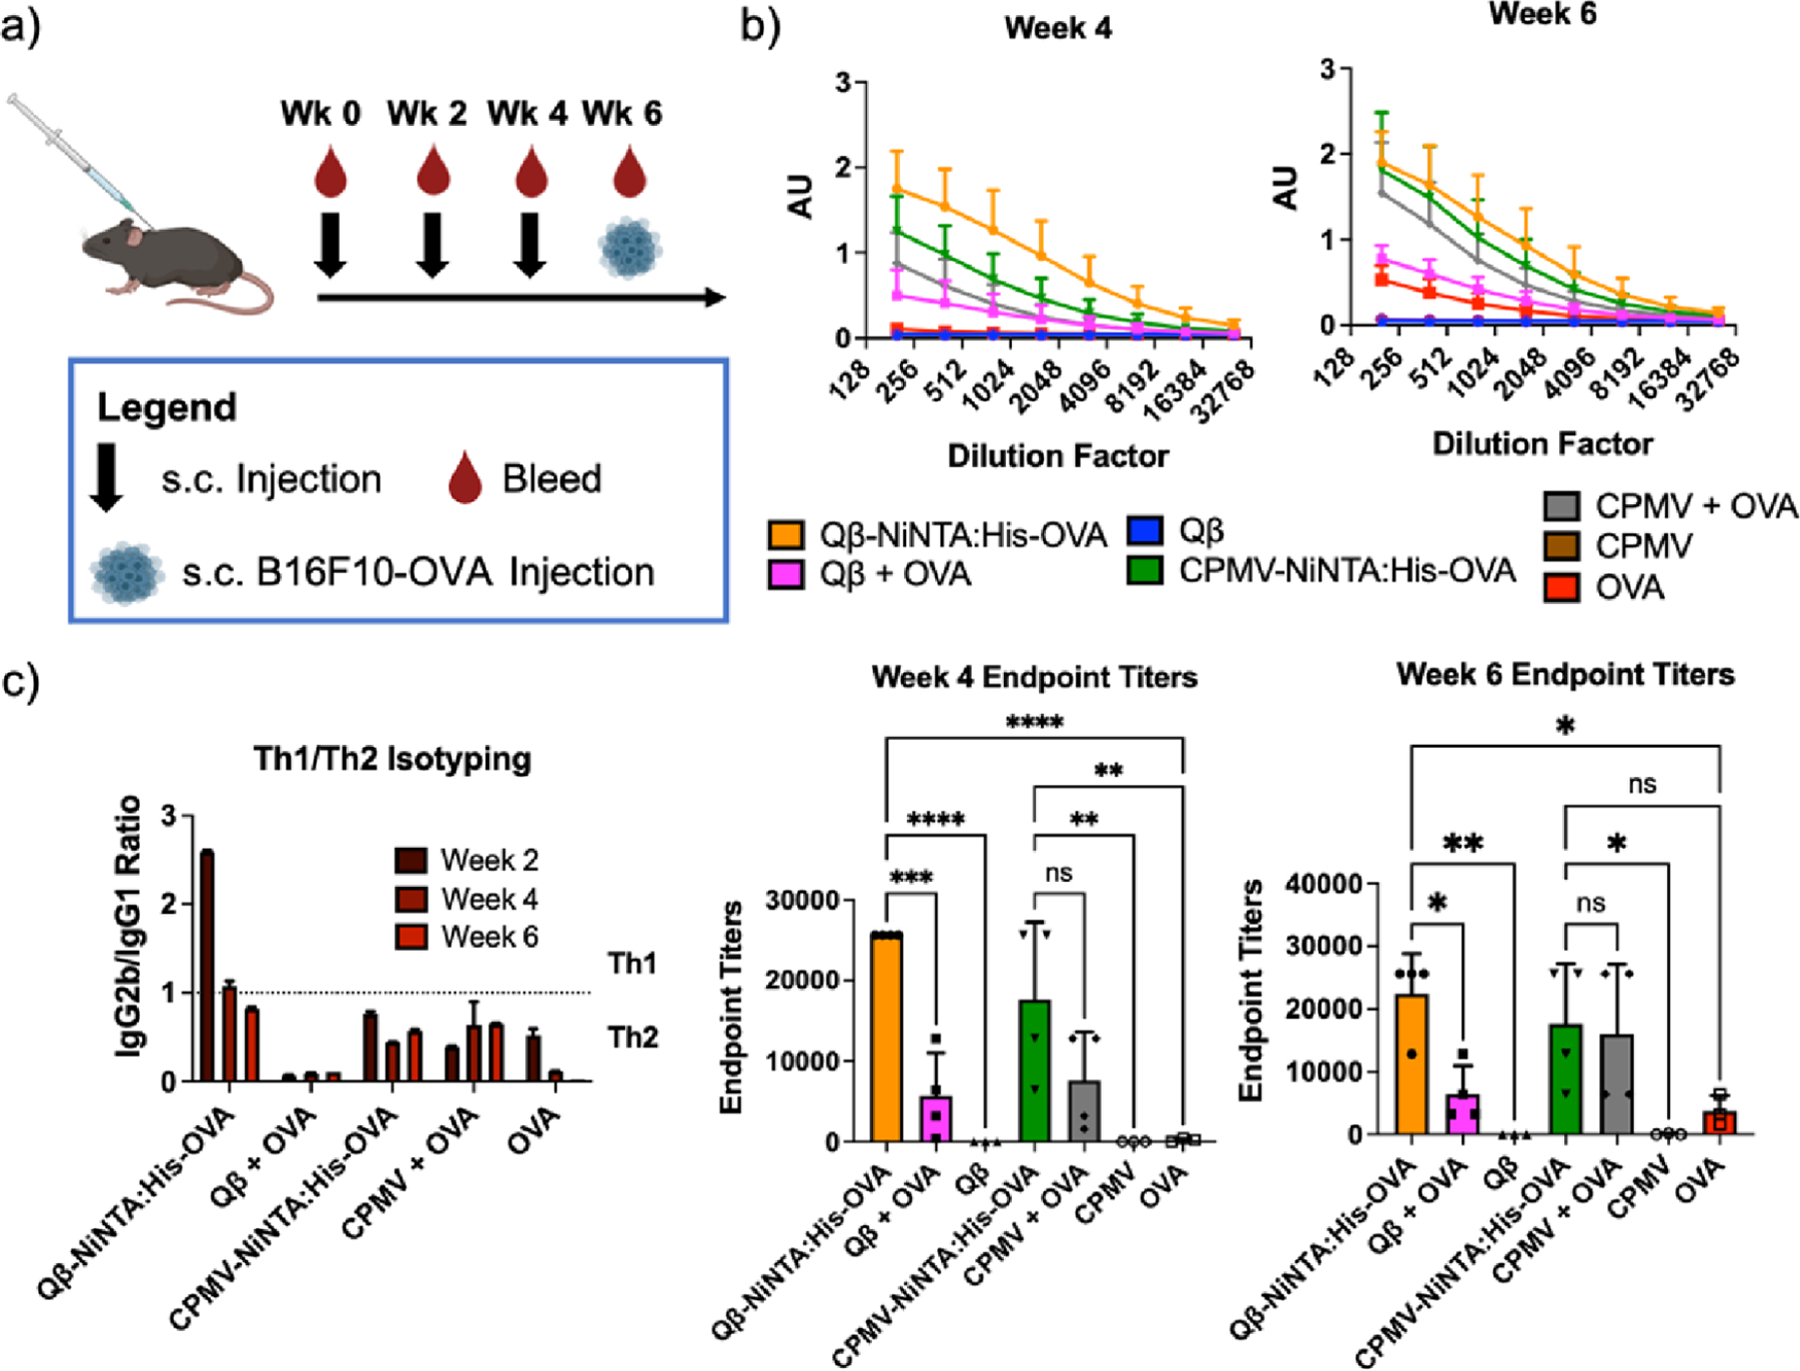
Figure 3.

Antibody titers against OVA. (a) Injection and bleeding schedule. (b) Complete ELISAs at weeks 4 and 6 as well as the endpoint titers. The endpoint titer was determined as the dilution at which the absorbance was greater than twice the blank. The week 2 data can be found in Figure S5. (c) IgG isotyping. An IgG2b IgG1−1 ratio < 1 was considered Th2 while a ratio > 1 was considered Th1. The full antibody profile can be found in Figure S5. * = p < 0.05, ** = p < 0.01, *** = p < 0.001, **** = p < 0.0001, ns = not significant. The injection schedule schematic was created on Biorender.com.
