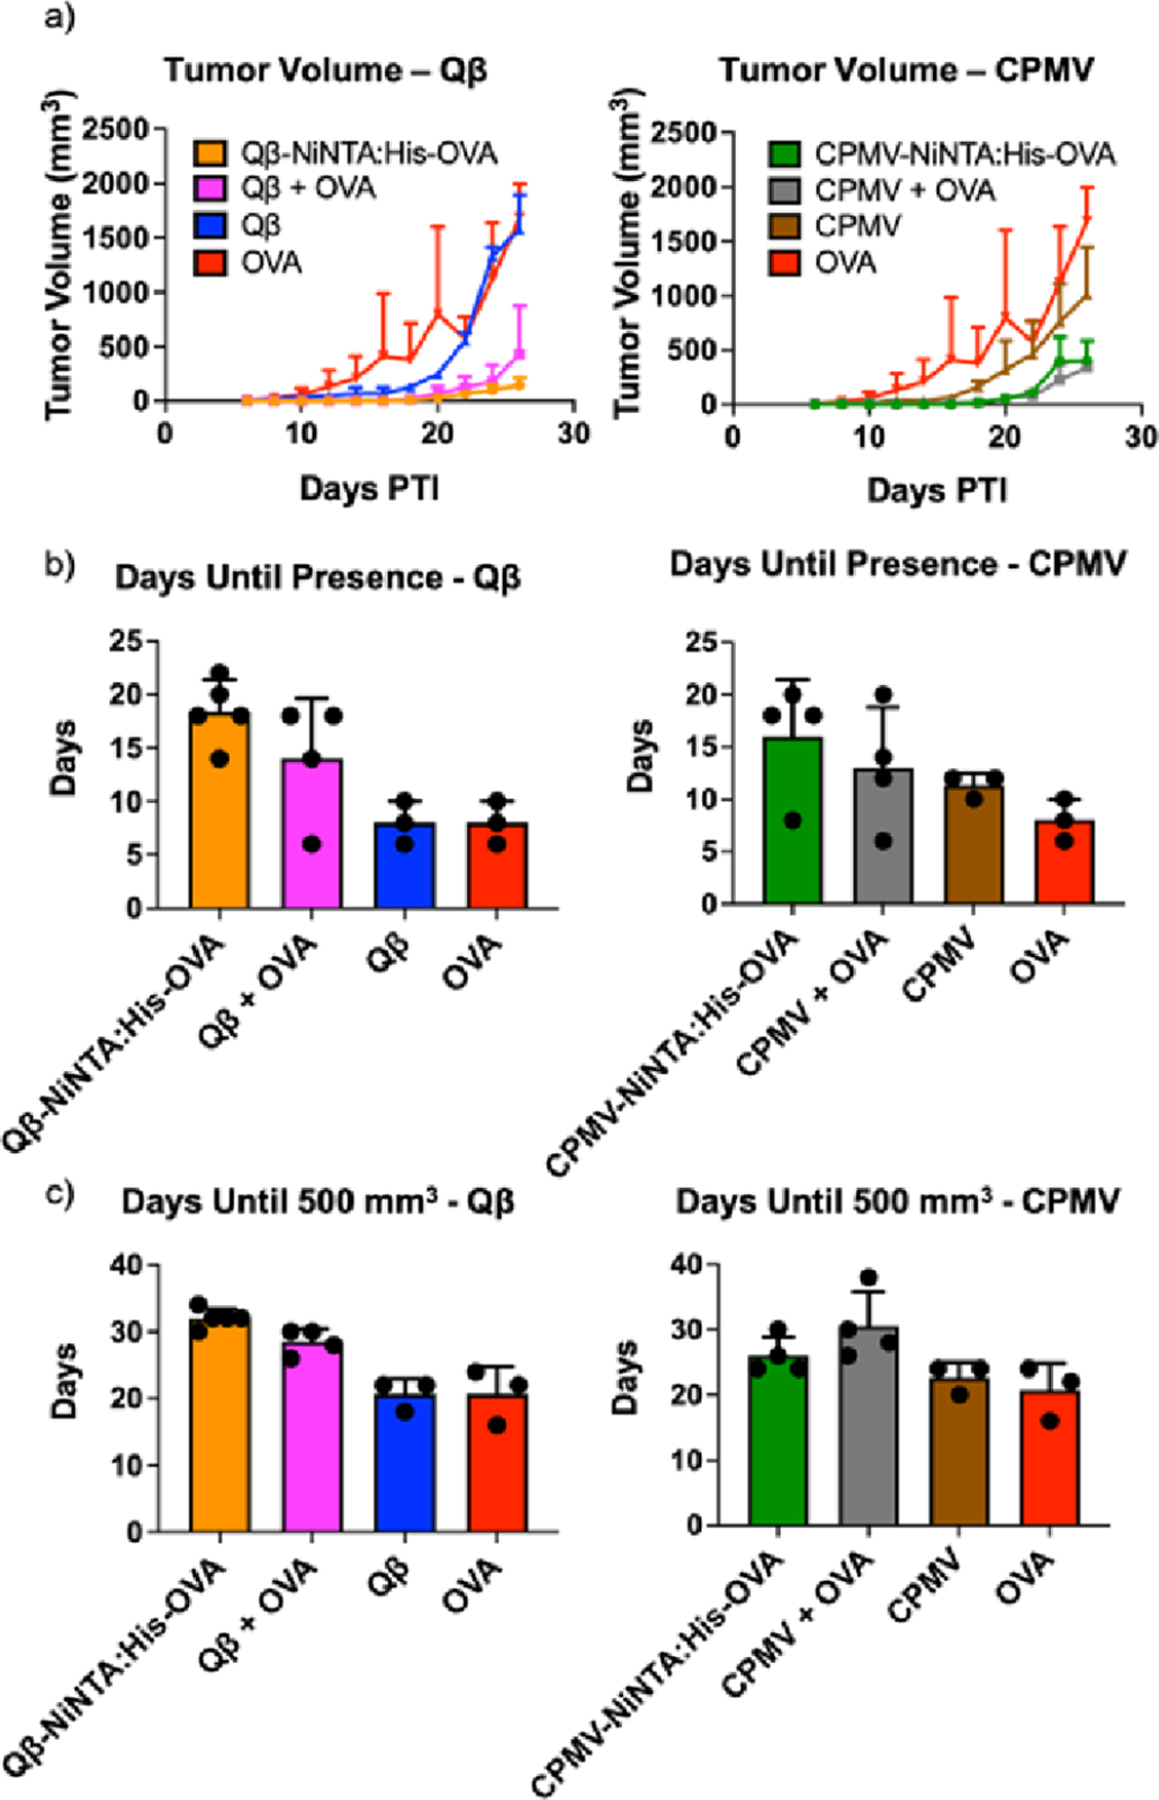
Figure 4.

Tumor volume curves and graphs. (a) Tumor volume curves. (b) Bar graph indicating how long it took before the tumors were discernible for measurement. (c) Bar graph indicating how long it took the tumors to reach a volume of 500 mm3. The CPMV and Qβ experiments in a-c were all done at the same time, but were separated into two for ease of viewing. The full graphs can be seen in Figure S6.
