
Figure 1.
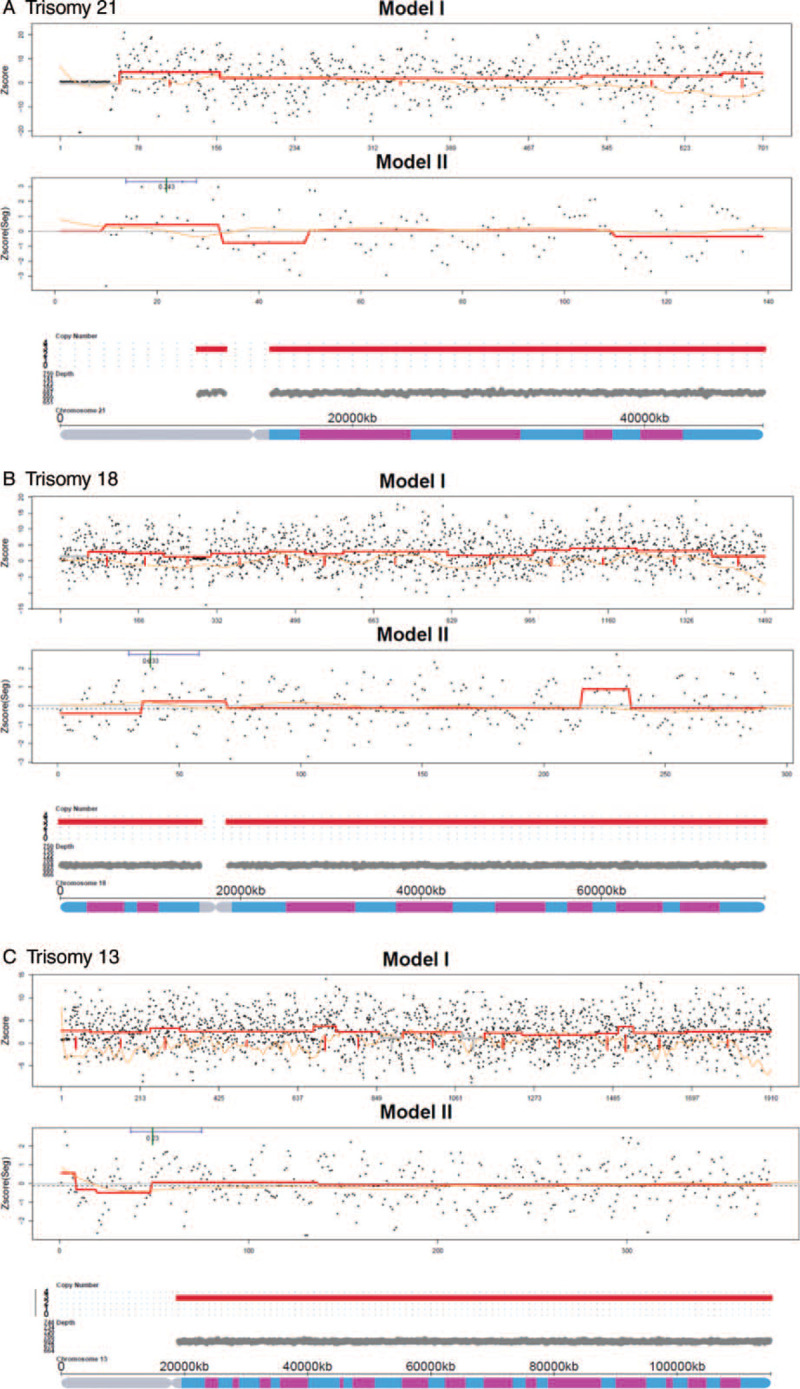
The positive trisomy examples of fetal CNVs detection. A: Trisomy 21. B: Trisomy 18. C: Trisomy 13. Model I: The Z-score distribution map generated by CNV detection is based on Reads count. The black dot (or red dot) indicates that the corresponding Z-score of each alignment window bins. The orange solid line indicates that GC bias of window bins. The blue solid line indicates that Z-score smoothing line is lower than normal. The red solid line indicates Z-score smoothing line is higher than normal. Model II: The Z-score distribution map generated by CNV detection is based on Real unique Reads count. The red line is the Z-score smoothing line generated according to the Z-score of each window bin. The red solid line fluctuates upwards indicates that Z-score is higher than normal. The red solid line fluctuates downwards indicates that Z-score is lower than normal. The 3rd picture is chromosomal diagram generated from Model I and Model II. Red, grey and green bars represent duplication, normal and deletion, respectively. The y-axis shows the chromosomal copy number variations.