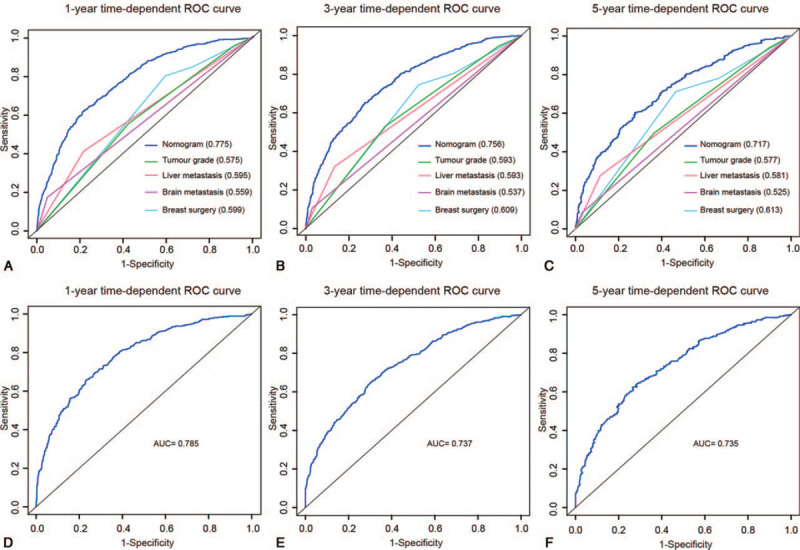
Figure 3.

ROC curves for predicting (A) 1-year, (B) 3-year, and (C) 5-year CSS between the nomogram-predicted and single independent factors in the training cohort, and (D) 1-year, (E) 3-year, and (F) 5-year CSS in the validation cohort. The values in brackets of A-C represent the area under the ROC curves (AUC).
