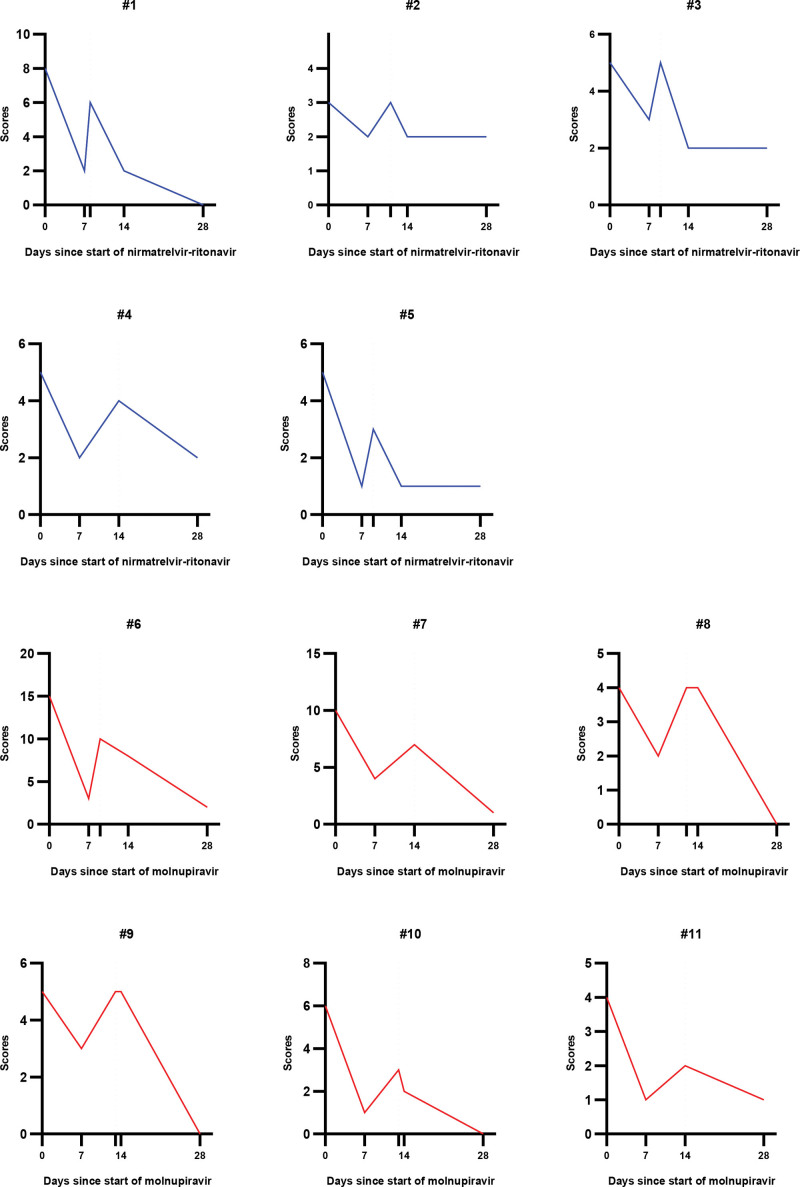
Figure 1.
Changes in symptom scores in each coronavirus disease 2019 (COVID-19) rebound patient. Changes in symptom scores in patients with COVID-19 rebound over time after antiviral therapy initiation. Each number represents a patient with COVID-19 rebound. The blue graphs show symptom scores for patients treated with nirmatrelvir-ritonavir. The red graphs show the symptom scores of patients treated with molnupiravir. The y-axis denotes the symptom scores, and the x-axis denotes the number of d since the start of the antiviral therapy. Additional tick between d 7 and 14 without a number on the x-axis indicates the d of clinical rebound for each patient. For patients #4, #7, and #11, the d of clinical rebound is d 14.

