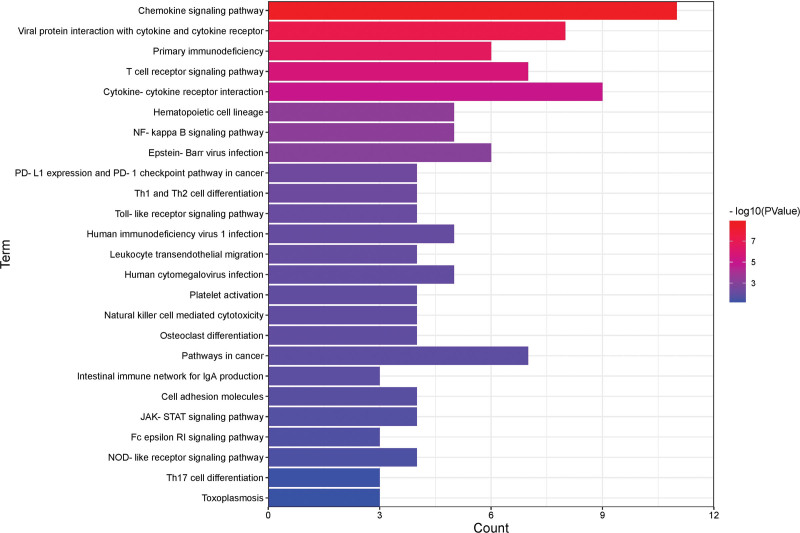
Figure 4.
KEGG pathway terms of DEGs. A histogram of KEGG enrichment analysis of upregulated genes, which shows a gradual change in color from red to blue, indicating the change in the P value from small to large. DEGs = differentially expressed genes, KEGG = Kyoto Encyclopedia of Genes and Genomes.

