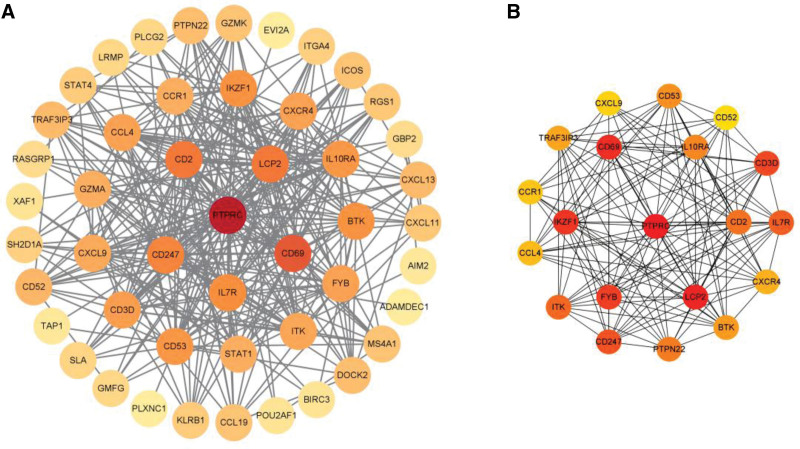
Figure 5.
PPI networks for 48 upregulated DEGs (A) and the top 20 hub genes (B) were constructed using Cytoscape visualization, which shows a gradual change in color from yellow to red, indicating the change score from small to large. DEGs = differentially expressed genes, PPI = protein–protein interaction.

