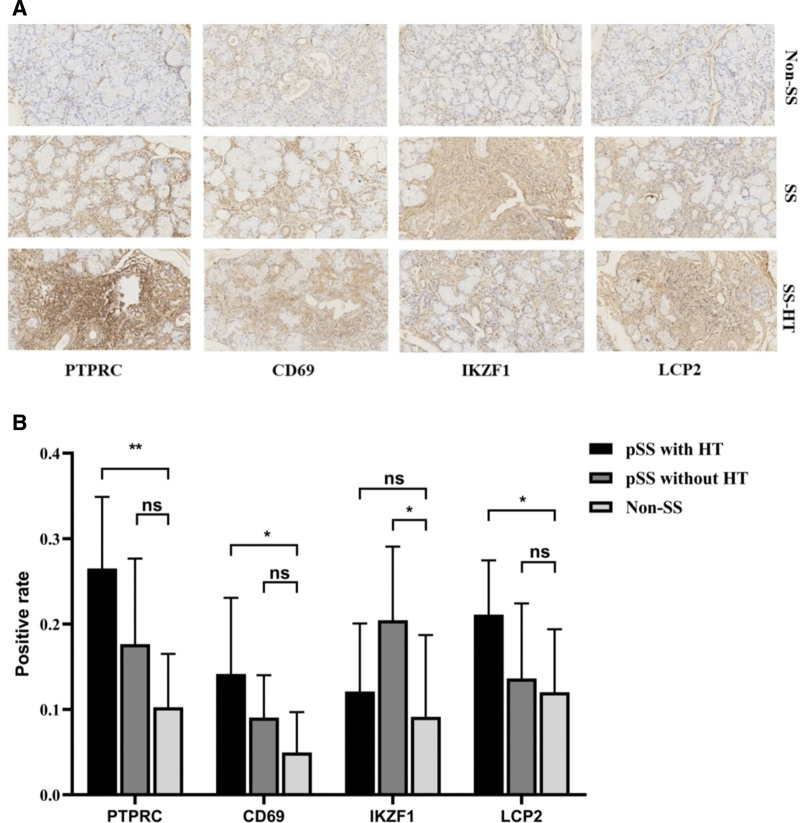
Figure 6.
H&E and immunohistochemical analysis of PTPRC, CD69, IKZF1, and LCP2 proteins in minor salivary gland biopsy (MSGB) staining from 9 SS with HT patients, 9 SS without HT patients, and 6 non-SS patients(magnification: ×200 for H&E staining and × 200 for IHC) (A). Blue marks the nucleus, and brown marks the target protein. The bar graph indicated medians within the quartile ranges of positive rate (B). ns, not significant, *, P < .05; **, P < .01.

