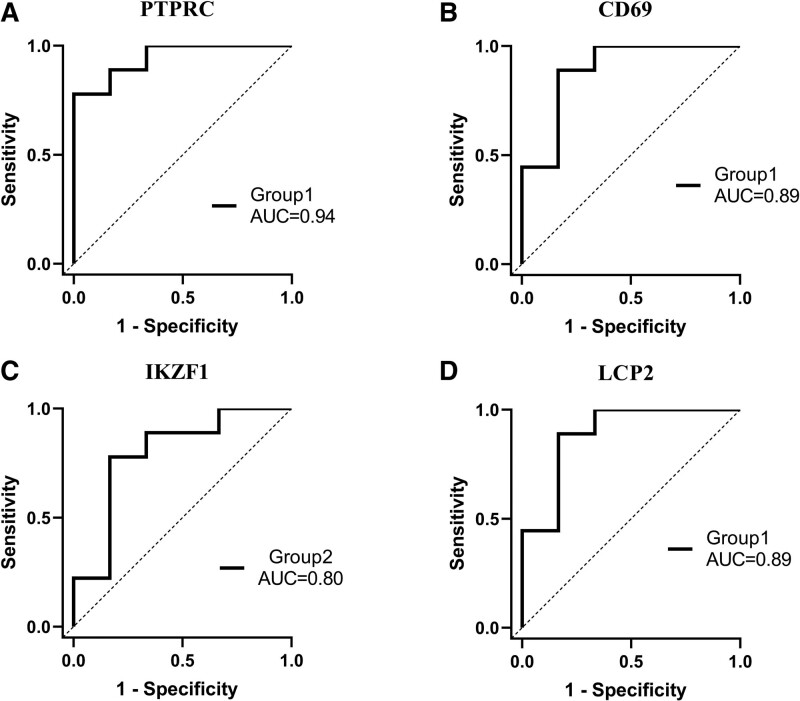
Figure 7.
ROC curves analysis of positive rate of immunohistochemical results for 3 groups (Group 1: SS with HT patients, Group 2: SS without HT patients). (A) PTPRC, (B) CD69, (C) IKZF1, (D) LCP2. An AUC > 0.8 indicated that the predicted model had good efficacy. The AUC was also shown. AUC = area under the curve, ROC = receiver operating characteristic.

