
Figure 3. Identifying epigenetic elements and TFs associated with heterogeneous cellular states of newborn cells in the mouse brain.
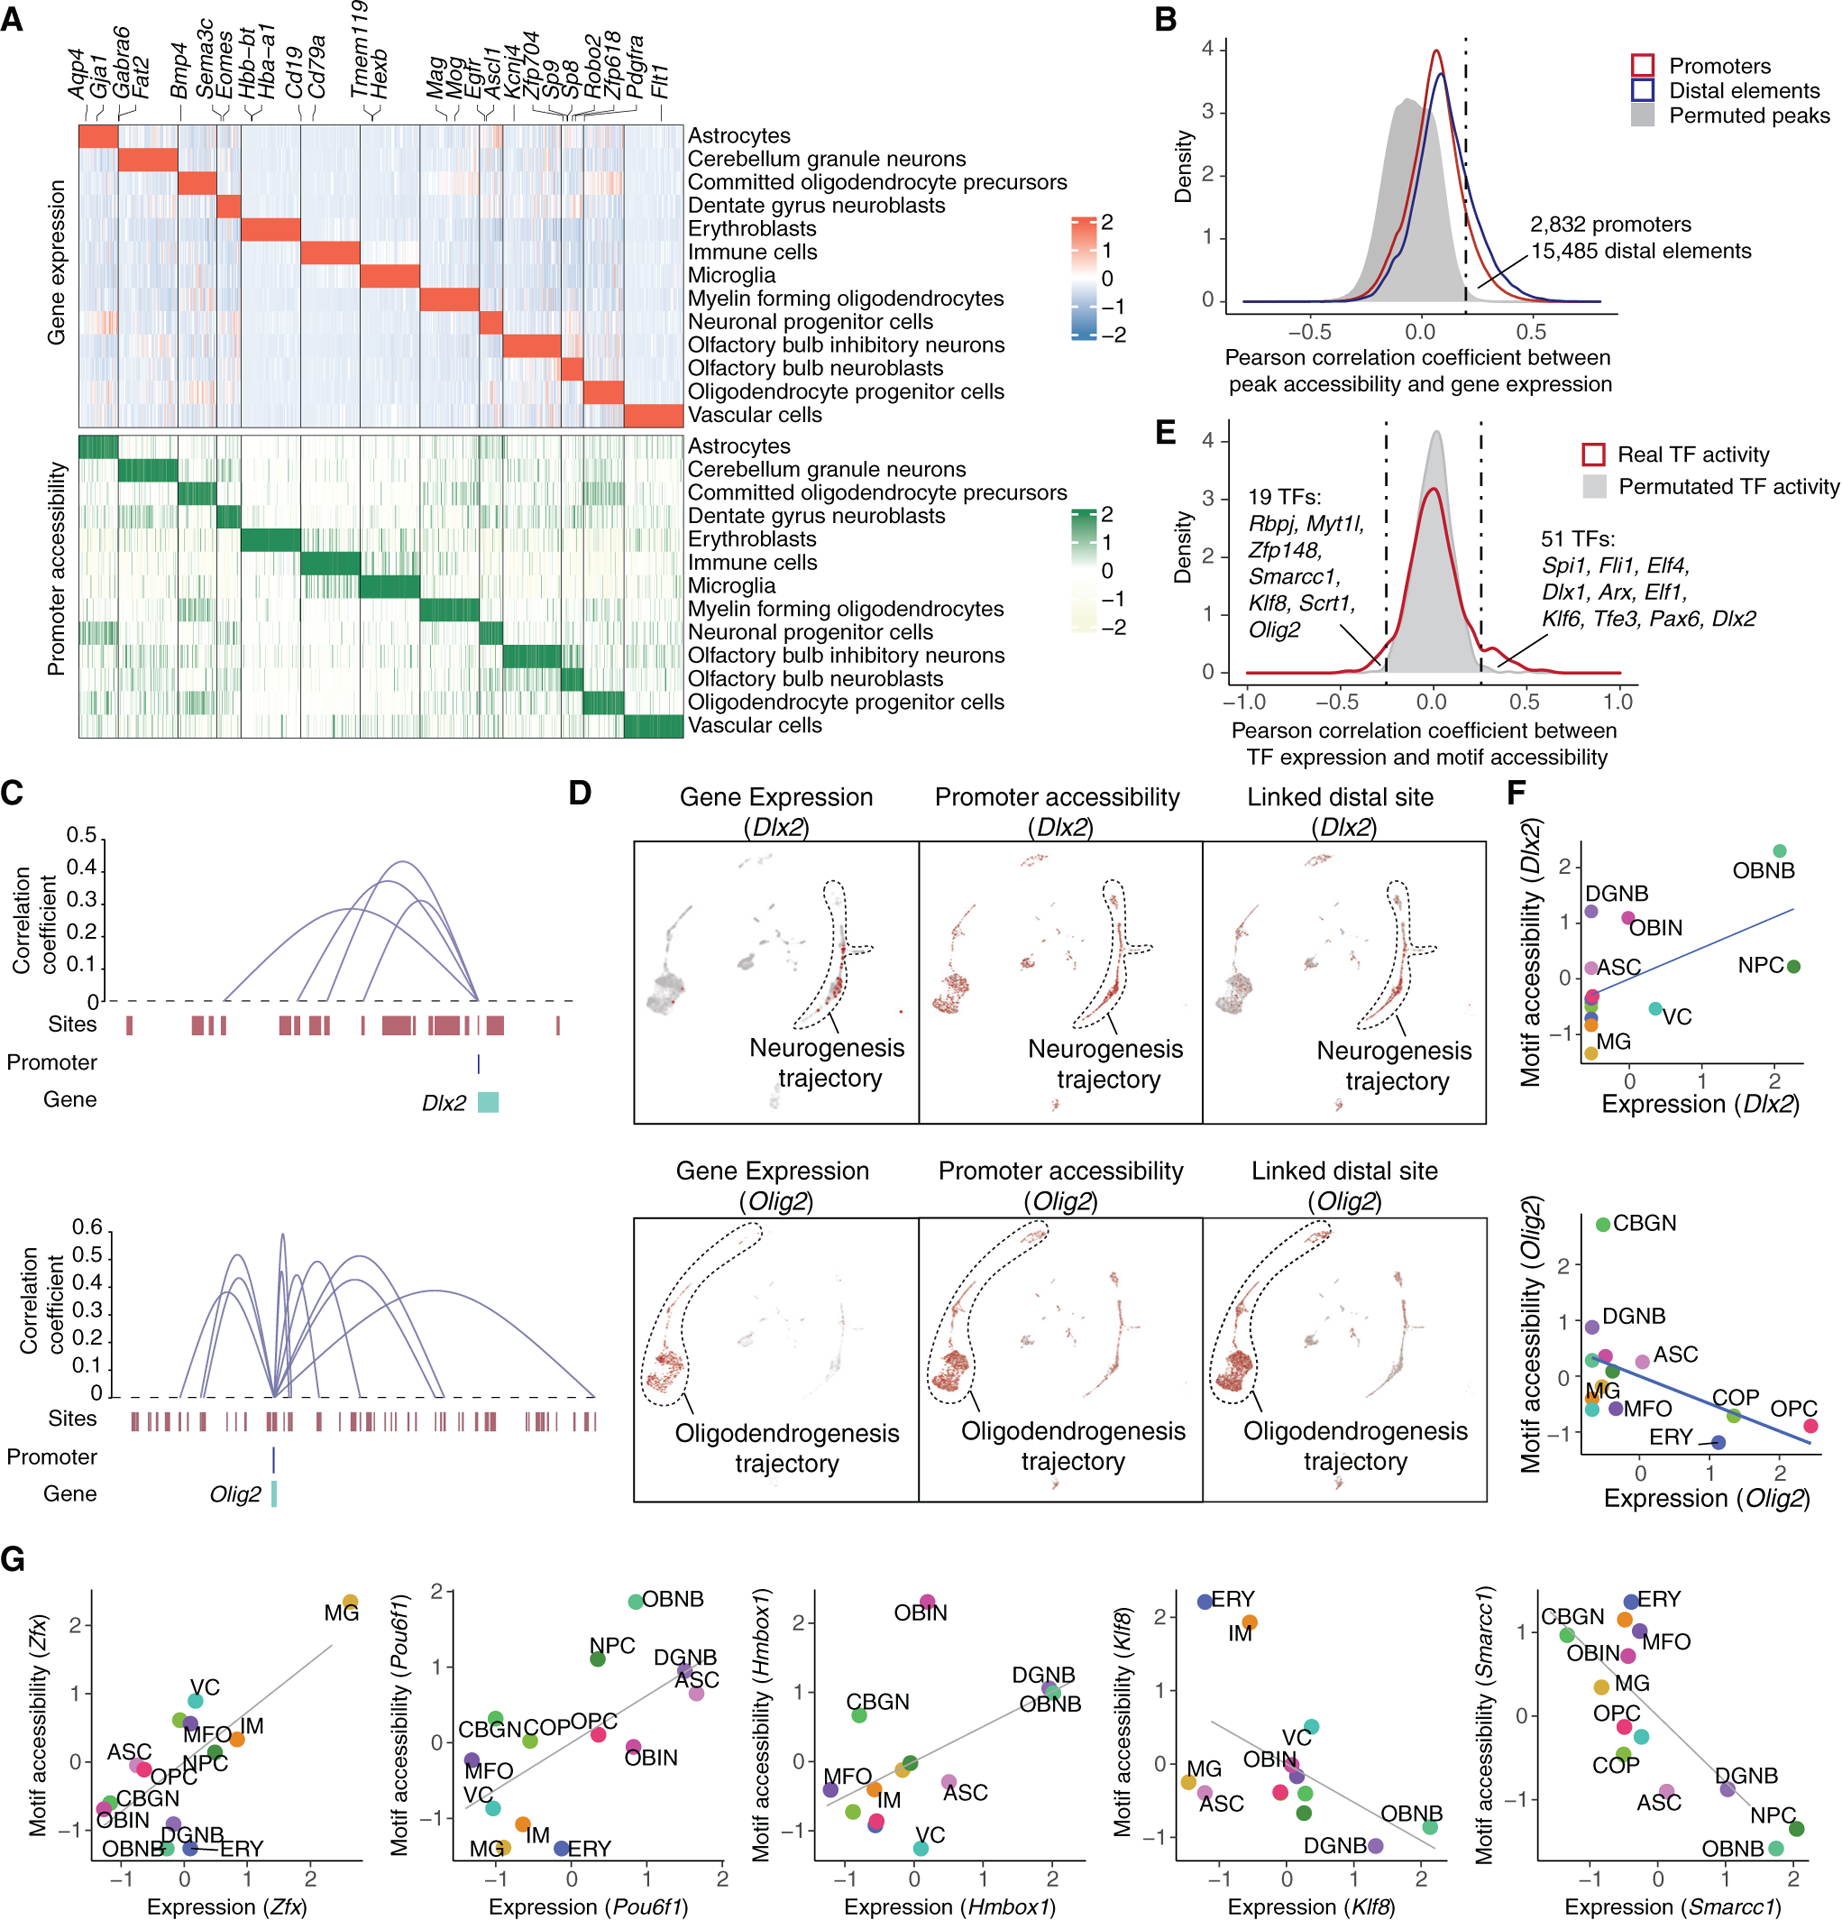
(A) Heatmap showing the relative expression (top) and chromatin accessibility (bottom) of cell-type-specific genes across cell types. Each row represents the aggregated gene expression or promoter accessibility for a specific cell type. All conditions are included into the calculation.
(B) Density plot showing the distribution of Pearson correlation coefficients between gene expression and the accessibility of promoter (red) or nearby accessible elements (±500 kb of the promoter, blue) across pseudo-cells. Background distribution by permuting pseudo-cells is colored in gray.
(C) Genome browser plot showing links between distal regulatory sites and genes for a neurogenesis marker (Dlx2, top) and an oligodendrogenesis marker (Olig2, bottom).
(D) UMAP plots showing the cell-type-specific expression (left), the accessibility of promoter (middle), and linked distal site (right) for genes Dlx2 (top) and Olig2 (bottom).
(E) Density plot showing the distribution of Pearson correlation coefficients between TF expression and their motif accessibility across pseudo-cells. Background distribution by permuting pseudo-cells is colored in gray.
(F) Scatterplots showing the correlation between the scaled gene expression and motif accessibility across cell types for Dlx2 (top) and Olig2 (bottom), together with a linear regression line. ASC, astrocyte; CBGN, cerebellum granule neuron; COP, committed oligodendrocyte precursor; DGNB, dentate gyrus neuroblast; ERY, erythroblast; MFO, myelin-forming oligodendrocyte; MG, microglia; NPC, neuronal progenitor cell; OBNB, olfactory bulb neuroblast; OBIN, olfactory bulb inhibitory neuron; OPC, oligodendrocyte progenitor cell; VC, vascular cell.
(G) Scatterplots showing the correlation between the scaled gene expression and motif accessibility of less-characterized TF regulators, together with a linear regression line.