. 2023 Oct 2;12:RP88049. doi: 10.7554/eLife.88049

Figure 5. Beiging of white adipose tissue (WAT) in ADGAT DKO mice.

(A) ADGAT DKO mice contain multi-locular lipid droplets (LDs) in adipocytes of inguinal WAT (iWAT). H&E-stained sections of iWAT from male mice fed a chow diet and housed at room temperature (n=6). Scale bars, 50 µm. (B) Increased expression of thermogenic marker genes in iWAT of ADGAT DKO mice. Relative mRNA levels of thermogenic genes in iWAT of male mice fed a chow diet and housed at room temperature (n=6). (C) ADGAT DKO mice contain multi-locular LDs in adipocytes of gonadal white adipose tissue (gWAT). H&E-stained sections of gWAT from male mice fed a chow diet and housed at room temperature (n=6). Scale bars, 50 µm. (D) Increased expression of thermogenic marker genes in gWAT of ADGAT DKO mice. Relative mRNA levels of thermogenic genes in gWAT of male mice fed a chow diet and housed at room temperature (n=6). (E) High-fat diet (HFD) feeding increases levels of UCP1 in iWAT of ADGAT DKO mice. Immunoblot analysis of UCP1 and OXPHOS proteins in iWAT of male mice fed either a chow diet or an HFD (n=3). Mice were housed at room temperature. (F) Beiging was intact in iWAT of thermoneutral-housed ADGAT DKO mice. Relative mRNA levels of thermogenic genes in iWAT of chow-diet-fed male mice housed at thermoneutral temperature for 6 weeks (n=6). (G) Blood glucose levels were normal in thermoneutral-housed ADGAT DKO mice. Glucose levels in male mice fed a chow diet and housed at thermoneutral temperature for 6 weeks (n=8). Data are presented as mean ± SD. *p<0.05, **p<0.01, ***p<0.001.

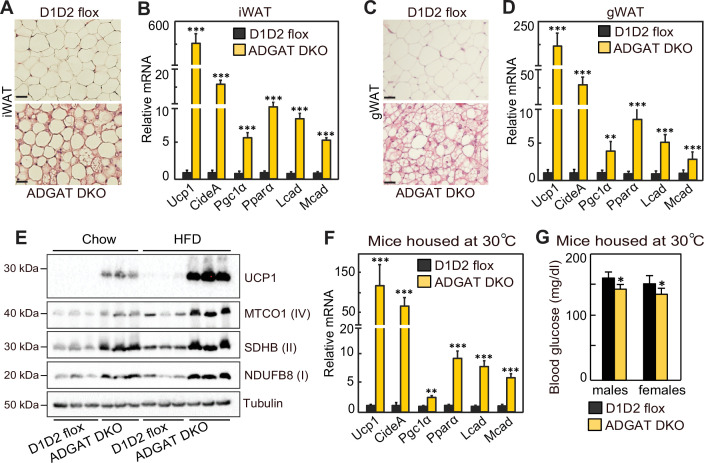
Figure 5.

Figure 5—figure supplement 1. Analysis of metabolites in inguinal white adipose tissue (iWAT) of ADGAT DKO mice.

Figure 5—figure supplement 1.

(A) Volcano plot showing differentially abundant metabolites in inguinal white adipose tissue (iWAT) of chow-diet-fed male mice (n=8). (B) Volcano plot showing differentially abundant metabolites in inguinal brown adipose tissue (iBAT) of chow-diet-fed male mice (n=8). Orange dots represent metabolites with more than twofold change (adjusted p values or q<0.05). Blue dots represent metabolites with more than twofold change but not statistically significant. Gray dots represent metabolites that were unchanged between control and ADGAT DKO mice.
Figure 5—figure supplement 2. Primary adipocytes cultured from inguinal white adipose tissue (iWAT) of ADGAT DKO mice contain lipid droplets.

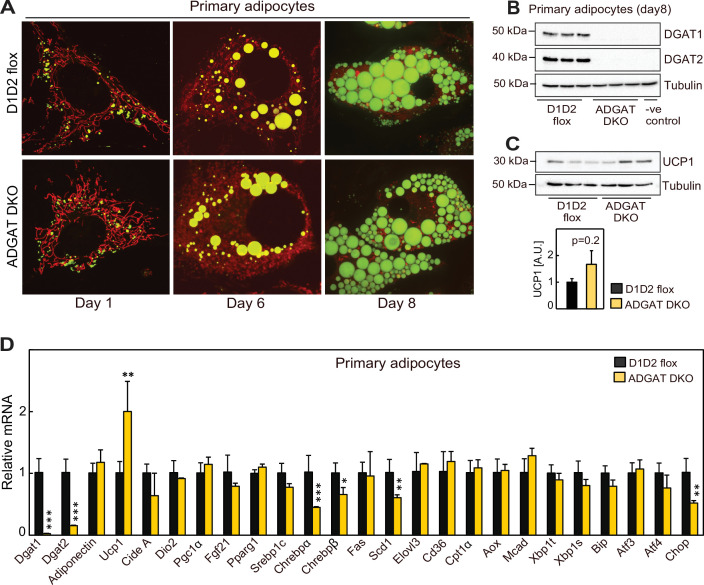
Figure 5—figure supplement 2.

(A) Primary adipocytes differentiated from stromal vascular fraction of inguinal white adipose tissue (iWAT) from ADGAT DKO male mice contain lipid droplets (LDs). LDs were stained by BODIPY 493/503. (B and C) Western blot analysis of DGATs and UCP1 in primary adipocytes (n=3). (D) Relative mRNA levels in day 8 primary adipocytes loaded with oleic acid for 16 hr (n=3). Data are presented as mean ± SD. *p<0.05, **p<0.01, ***p<0.001.
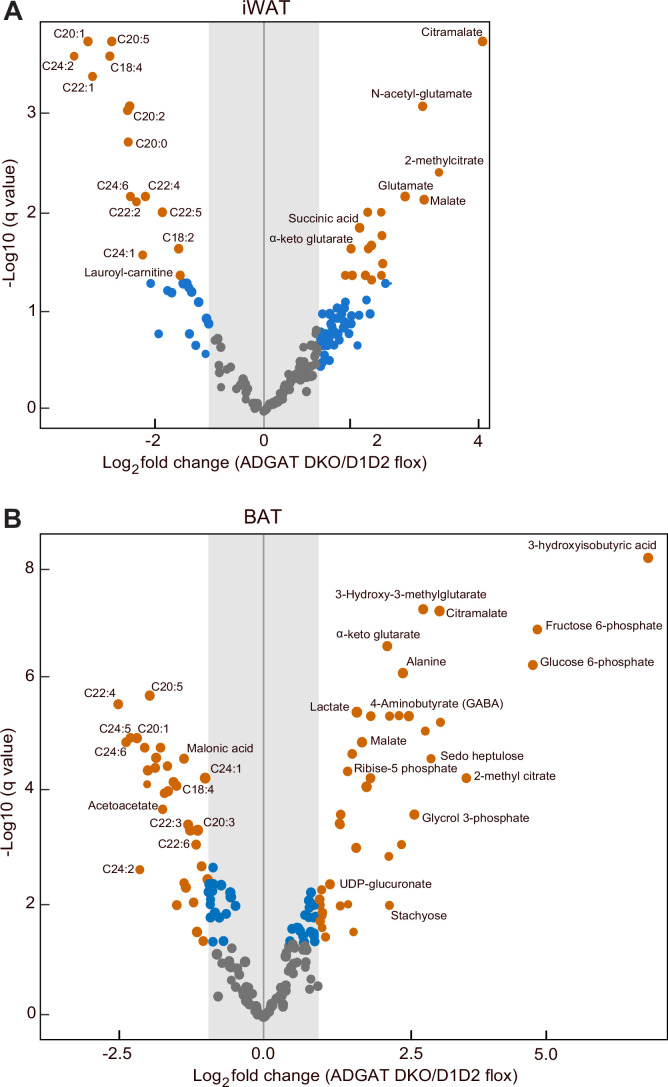
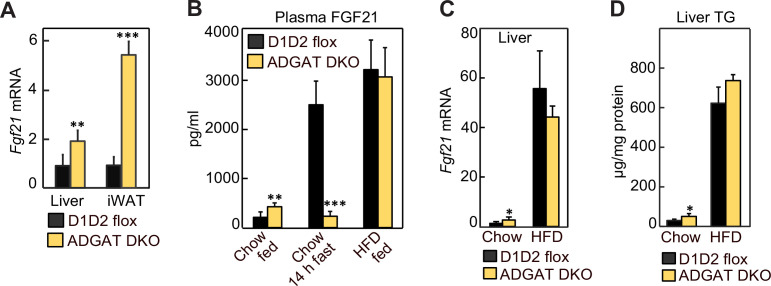
Figure 5—figure supplement 3. Fibroblast growth factor 21 (FGF21) levels were increased in ADGAT DKO mice.

Figure 5—figure supplement 3.

(A) FGF21 transcript levels were increased in inguinal white adipose tissue (iWAT) and livers of ADGAT DKO mice. Relative mRNA levels of FGF21 in iWAT and livers of chow-diet-fed male mice (n=6). (B) FGF21 levels were increased in ADGAT DKO mice. Plasma levels of FGF21 in chow-diet-fed (ad libitum fed or 14 hr fasted) or high-fat diet (HFD)-fed male mice (n=8). (C) FGF21 transcript levels in livers of chow-diet- or HFD-fed male mice (n=6). (D) Triglyceride levels in livers of chow-diet- or HFD-fed male mice (n=6). Data are presented as mean ± SD. *p<0.05, **p<0.01, ***p<0.001.