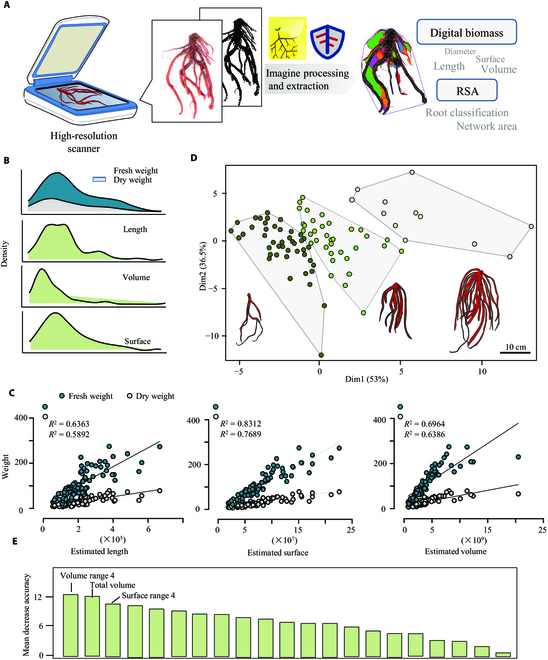
Fig. 2.

Phenotyping of S. miltiorrhiza root based on scanning images of the whole root system. (A) The workflow used for root phenotyping and data analysis. High-throughput imaging data from the WinRHIZO scanning system were imported and processed using WinRHIZO and RhizoVision. The extracted phenotypic traits were further evaluated for biomass estimation and RSA study. (B) The distribution of parameters related to the biomass of S. miltiorrhiza roots. (C) Linear regression analysis between real biomass (Fresh weight and Dry weight) and extracted parameters (Total Length, Total Surface, and Total Volume). (D) K-means clustering of S. miltiorrhiza roots samples (n = 92) according to the diameter ranges of each root branch. The root model represented the typical root structure among each cluster. The bar represented the size of each root model. (E) The importance evaluation of phenotypic traits according to the K-means clustering using the random forest model.
