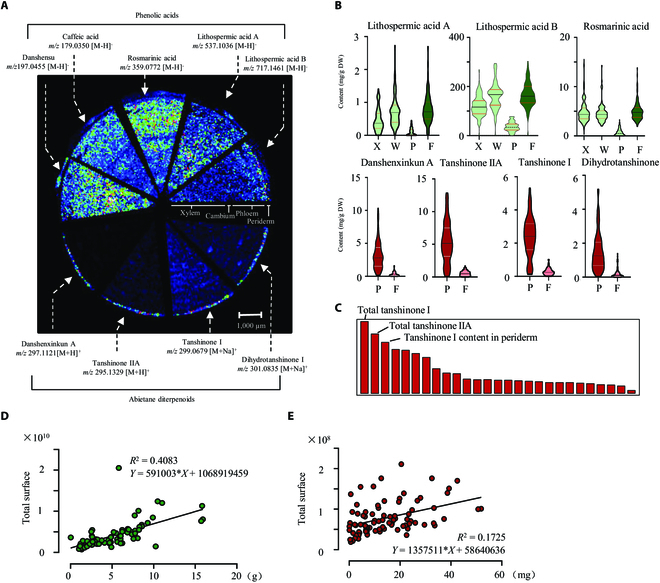
Fig. 4.

Metabolic profiling of pharmaceutic metabolites in S. miltiorrhiza roots and their correlation with phenotypic traits. (A) Mass spectrometry imaging by MALDI-MS showed the spatial distribution of 2 classes of effective metabolites on a section of S. miltiorrhiza root with a spatial resolution of 75 μm. The ion strength is color-coded (white = maximal signal and black = minimal signal) and normalized. (B) Content of phenolic acids and tanshinones in different root tissues measured by HPLC-MS/MS. X, xylem; W, phloem and cambium layers; P, periderm, F, the whole root segment. (C) ML represented the most variable metabolic traits according to K-means clustering shown in Fig. 2E. The top 3 parameters were labeled. Linear regression analysis showed that the production of LAB (D) was significantly correlated to the selected phenotypic trait (Total Surface), while tanshinone IIA (E) was small but significantly correlated to the selected phenotypic trait (Total Surface).
