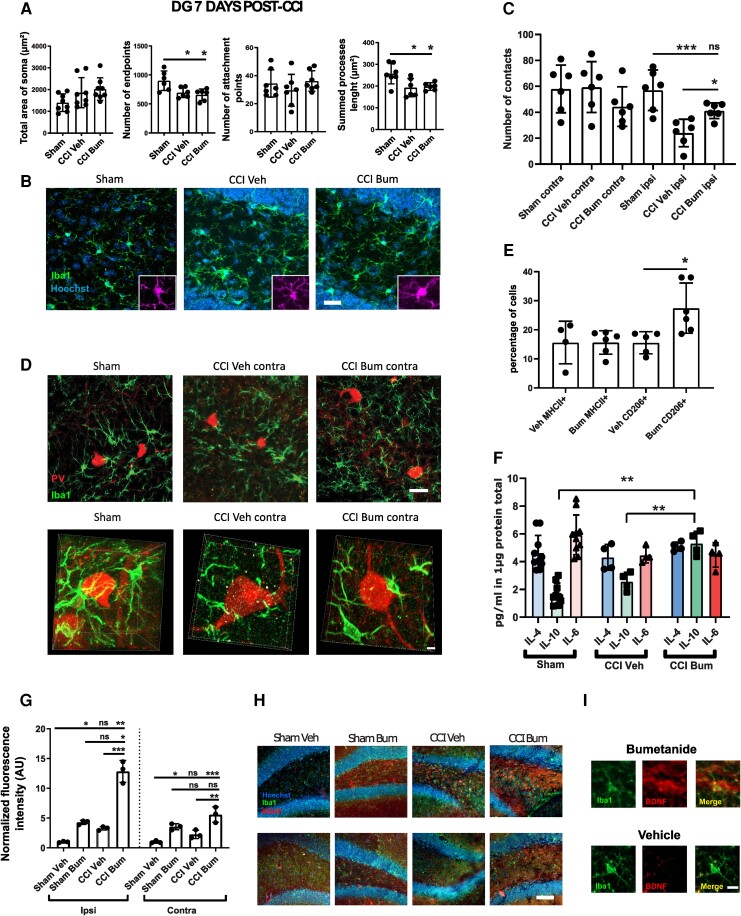
Figure 5.
Effect of bumetanide on microglia phenotypes and morphological changes after CCI in the DG at 7 days post-CCI. (A) Total area of Iba1 + cells soma, quantifications of Iba1 + process end points, attachment points and length in the contralesional DG 7 days post-CCI. n = 5 animals, two slices per animal. (B) Iba1 immunostaining from sham-, CCI vehicle- and CCI bumetanide-treated animals in the contralesional DG. (C) Quantification of the number of contacts between microglia (Iba1 staining) and PV interneurons at 7 days post-CCI. n = 5 animals per condition, three slices per animal. (D) Example of PV and Iba1 immunostaining, from sham-, CCI vehicle- and CCI bumetanide-treated animals in the contralesional DG, 3D representations (top) and stack (bottom). (E) Analysis of microglia phenotypes by detection of MHCII+ (pro-inflammatory) and CD206+ (pro-phagocytosis) markers by flow cytometry on the contralesional side at 7 days post-CCI. n = 5–6 animals per condition. (F) Quantity of IL-4, IL-10 and IL-6 produced in the contralesional hippocampus. (G) Quantification of BDNF signal intensity within microglia of the ipsi- and contralesional brain of sham vehicle-, sham bumetanide-, CCI vehicle- and CCI bumetanide-treated animals. (H) Example of Iba1 and BDNF staining in DG of sham and CCI animals treated with bumetanide or vehicle. (I) Example of Iba1 and BDNF staining in a single microglial cell. n = 3, three slices per animal. Phenotype changes were analysed by Student's t-test. Number of contacts and morphological analysis (quantified using the ImageJ plugins Neurphology and SynapCountJ) were analysed using a one-way ANOVA with Dunnett's post hoc test. Interleukin production was analysed using a Kruskall–Wallis test for IL-10. *P < 0.05; **P < 0.01; ***P < 0.00; ns = not significant.

