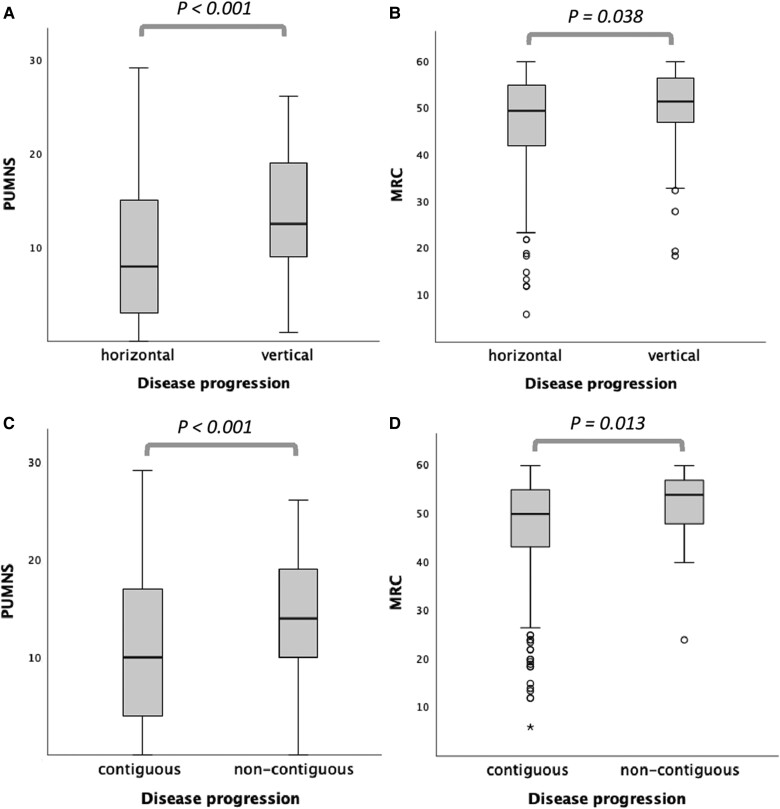
Figure 3.
Kruskal-Wallis analysis to compare motor features among different patterns of disease progression. Distribution of upper motor neuron involvement using the Penn Upper Motor Neuron Score (PUMNS) and lower motor neuron involvement using the Medical Research Council Muscle Scale (MRC) in patients with vertical versus horizontal (A and B) and contiguous versus non-contiguous (C and D) pattern of disease progression from site of onset. Kruskal-Wallis test for independent samples. For each group, the bold horizontal line shows the median, the grey box includes the middle 50% of the data and whiskers show the minimum and maximum values. Empty circles represent outliers (above Q3 + 1.5 IQR and below Q1 − 1.5 IQR, respectively).

