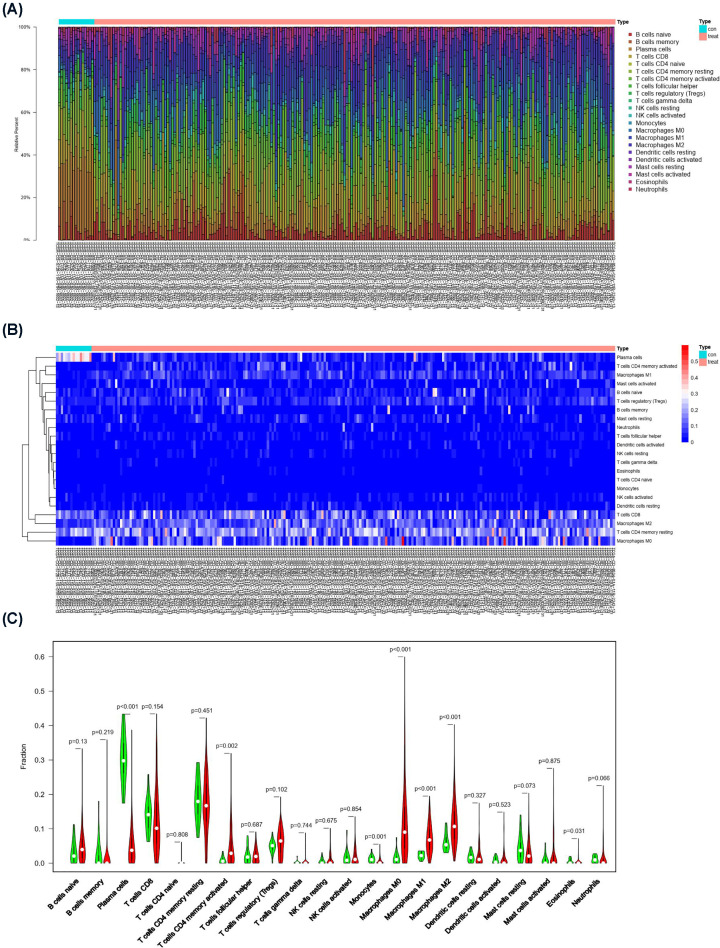
Figure 1. CIBERSORT analysis revealed that M2 macrophage polarization was the main immune infiltration pattern in GC.
(A) Bar graph showing the proportion of 22 types of immune cell infiltration in GC-adjacent tissue and tumor tissue. (B) Heat map showing the differences in the distribution of 22 types of immune cell infiltration in GC-adjacent tissue and tumor tissue. (C) Piano key diagram showing the differences in 22 types of immune cell components in GC-adjacent tissues and tumor tissues.

