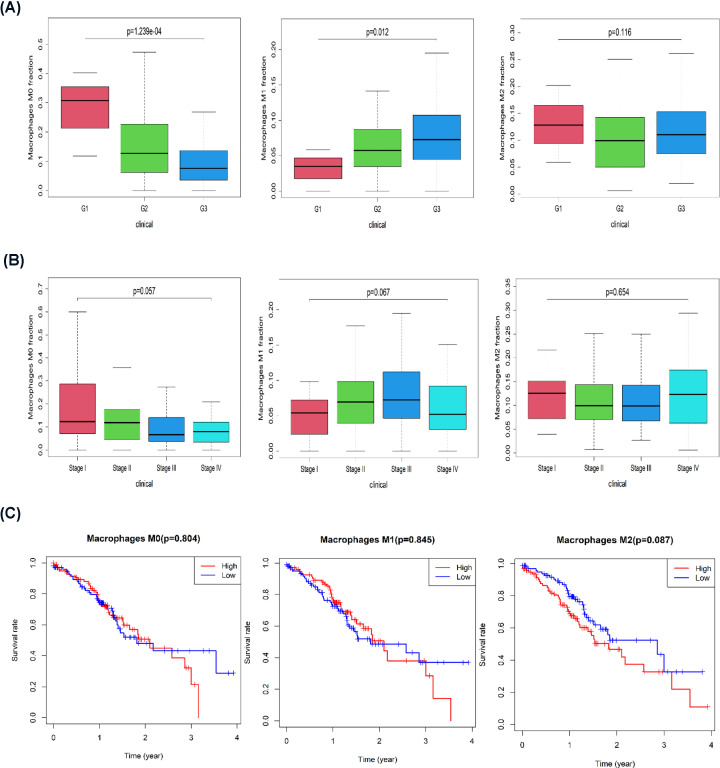
Figure 2. The polarization state of macrophages was closely related to the clinical characteristics of GC.
(A) Histogram showing the proportions of M0, M1, and M2 macrophages among different pathological grades. (B) Histogram showing the proportions of M0, M1, and M2 macrophages among different clinical stages. (C) Kaplan–Meier survival curve analysis of the relationship between the levels of M0, M1, and M2 macrophages and patient prognosis.

