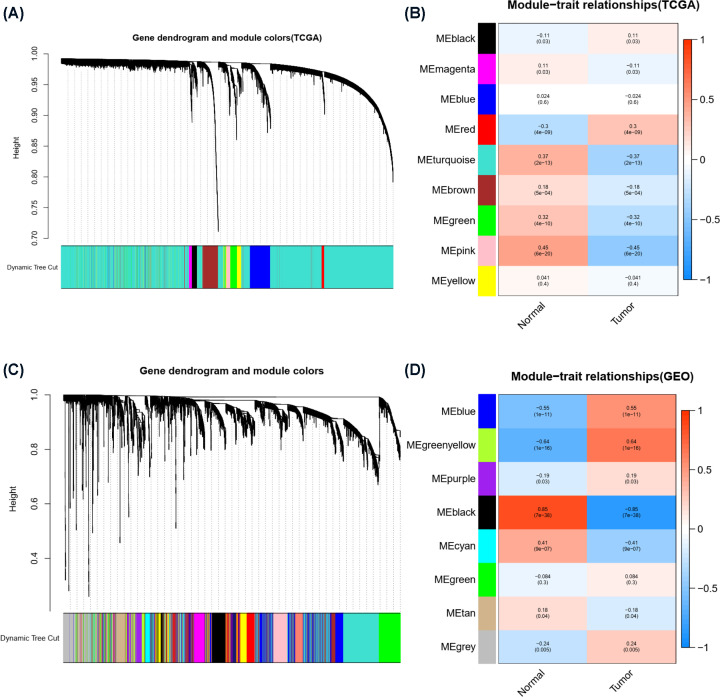
Figure 4. The risk score-related modules of STAD patients were determined by WGCNA.
(A) Clustering dendrogram of the coexpression network module from the TCGA database. (B) Heat map of the association analysis between the modules and traits from the TCGA database. Blue indicates a negative correlation, and red indicates a positive correlation. The P-value is shown in the figure. (C) Clustering dendrogram of the coexpression network module from the GSE54129 database. (D) The heat map of the association analysis between the modules and traits from the GSE54129 database. Blue indicates a negative correlation, and red indicates a positive correlation. The P-value is shown in the figure.

