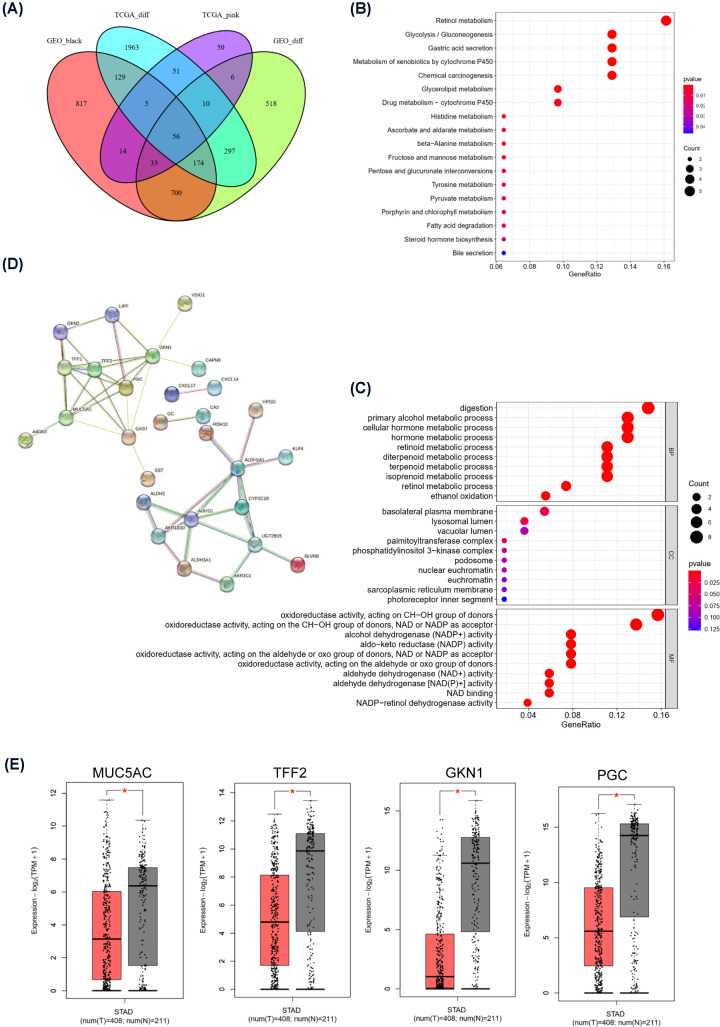
Figure 5. STAD hub genes and analysis.
(A) Common down-regulated protective genes were screened using a Venn diagram. (B) KEGG pathway enrichment analysis of protective genes. The X-axis represents the P-value, and the size of the bubble represents the number of protective genes. The Y-axis represents the terms of the significantly enriched pathways. (C) GO terms with significant enrichment of protective genes. The X-axis represents the adjusted P-value, and the size of the bubble represents the number of DEGs involved. The Y-axis represents the terms of significantly enriched functions. (D) Protein–protein interaction (PPI) network constructed with the protective genes in the STRING database. (E) Expression of hub genes (MUC5AC, TFF2, GKN1, and PGC) in STAD (Note: Red represents tumor tissue, and gray represents normal tissue). *P<0.01.

