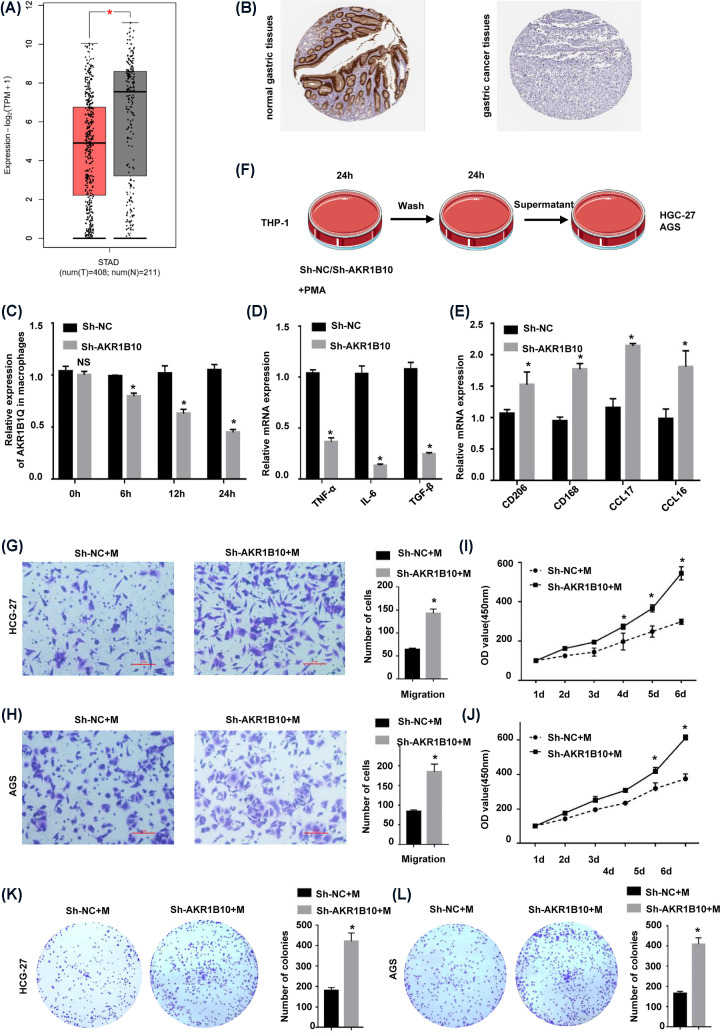
Figure 6. Down-regulation of AKR1B10 induced M2 macrophage polarization in GC.
(A) Expression of AKR1B10 in STAD. (Note: Red represents tumor tissue, and gray represents normal tissue.) (B) Immunohistochemical analysis of AKR1B10 protein expression in STAD tissue and normal tissue. (C) Detection of AKR1B10 expression in macrophages by RT-qPCR. (D) RT-qPCR detection of M2 macrophage markers (CD206, CD163, CCL17 and CCL18). (E) RT-qPCR detection of M1 macrophage markers (TNF-α, IL-6 and TGF-β). (F) The coculture model diagram of macrophages and gastric cancer cells. (G,H) Transwell results for HGC-27 and AGS GC cells cocultured with macrophages. (I,J) CCK-8 results for HGC-27 and AGS GC cells cocultured with macrophages. (K,L) Colony formation for HGC-27 and AGS GC cells cocultured with macrophages. *P<0.01.

