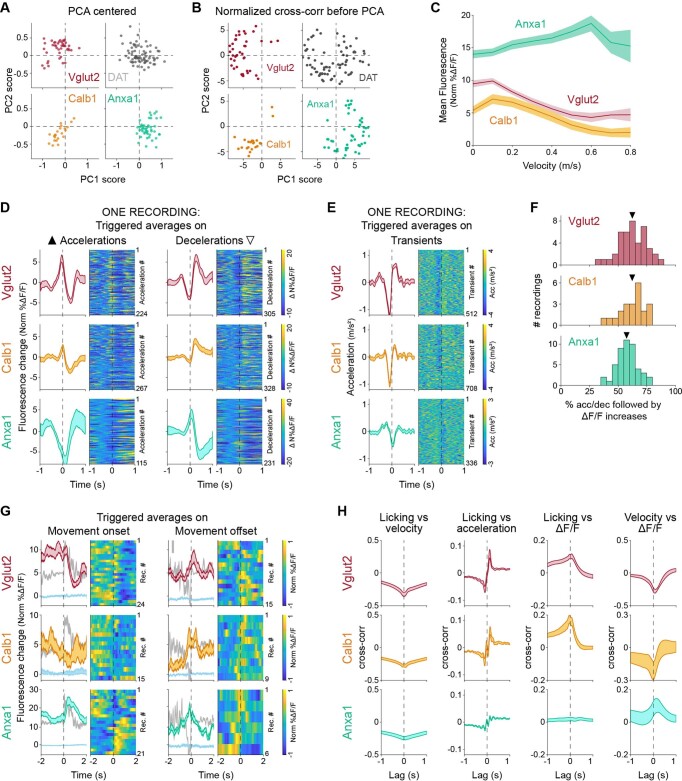
Extended Data Fig. 7. Dopaminergic genetic subtypes show different signaling patterns during locomotion continued.
(a) Principal component scores for each recording of each subtype and DAT along PC1 and PC2, as show in Fig. 2k but when PCA analysis is conducted with data centering, showing this variable does not have an effect in the differentiation of subtypes. (b) Principal component scores for each recording of each subtype and DAT along PC1 and PC2, as show in Fig. 2k but where the cross-correlations for each recording have been min-max scaled before running PCA analysis. This has a similar effect as considering only the angle of PC1/2 as shown in Fig. 2l, with recordings being pushed out into an annulus of which different subtypes occupy different sectors. (c) Ongoing velocity is encoded by each subtype. Average fluorescence for each subtype at different ranges of velocities (bin width 0.1 m/s). Error bands denote mean ± s.e.m. (D) Average ΔF/F triggered on large accelerations (left, ▲) and large decelerations (right, _) (as Fig. 2g) for one representative recording of each subtype. Shaded regions denote mean ± s.e.m. across events. Heatmap shows ΔF/F traces for each acceleration or deceleration for the recording in chronological order, shifted to better show relative changes in fluorescence (subtract average ΔF/F in a window −0.7 to −0.1 s before trigger points). (e) Average acceleration triggered on large transients (as Fig. 2h) for one representative recording of each subtype. Shaded regions denote mean ± s.e.m. across events. Heatmap shows acceleration traces for each transient in the recording in chronological order. (f) Percent of accelerations (for Anxa1) or decelerations (for Vglu2 and Calb1) followed by an increase in ΔF/F. Mean: Vglut2 = 62.4%, Calb1 = 62.3%, Anxa1 = 57.5%. (g) Average ΔF/F triggered on movement onsets (left) and offsets (right) for each subtype. Isosbestic control shown in light blue, same scale as ΔF/F average but shifted. Acceleration shown in grey in the background (scale bar = 0.5 m/s2). Shaded regions denote mean ± s.e.m. across recordings. Heatmap shows ΔF/F traces for each recording randomly sorted. Mice: Vglut2 = 10/8, Calb1 = 5/8, Anxa1 = 8/4. (h) Cross-correlations between different behavioral variables. Shaded regions denote mean ± s.e.m.

