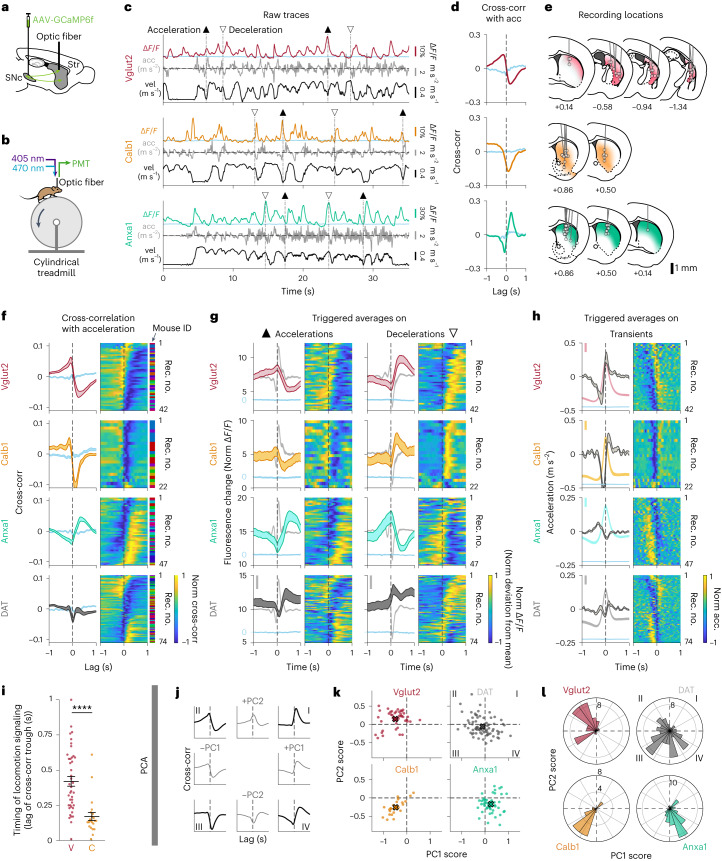
Fig. 2. Dopaminergic genetic subtypes display different signaling patterns during locomotion.
a, Strategy used to label dopamine neuron subtypes and record from their axons in striatum with GCaMP6f, a calcium indicator whose changes in fluorescence can be used as a proxy for neuronal firing. b, Schematic of fiber photometry recording setup. c, Example recordings from each subtype studied, showing fluorescent traces (ΔF/F), mouse acceleration and velocity. Isosbestic control shown in blue. ▲, large accelerations; ▽, large decelerations. d, Cross-correlation between ΔF/F traces and acceleration for traces shown in c. Isosbestic control shown in blue. e, Recording locations in striatum for recordings shown in f–h. Shaded colors represent projection patterns for each subtype. f, Average cross-correlation between ΔF/F traces and acceleration for all recordings of each subtype and DAT (subtypes indiscriminately labeled). Isosbestic control shown in blue. Shaded regions denote mean ± s.e.m. across recordings. Heat map shows cross-correlation for each recording, sorted by PC1/PC2 angle (see l). Vglut2 mice = 12, n = 42 recordings; Calb1 mice = 6, n = 22 recordings; Anxa1 mice = 10, n = 47 recordings; DAT mice = 14, n = 74 recordings. See Extended Data Fig. 6i for averages per mouse. g, ΔF/F averages triggered on large accelerations (left, ▲) and large decelerations (right, ▽) for all recordings of each subtype and DAT. Isosbestic control shown in blue, same scale as ΔF/F average but shifted for visibility. Acceleration shown in gray in background (scale bar, 0.2 m s−2). Shaded regions denote mean ± s.e.m. across recordings. Heat map shows triggered average for each recording, sorted as in f. h, Acceleration averages triggered on ΔF/F transient peaks for all recordings of each subtype and DAT. ΔF/F average and isosbestic control shown in background (bar, 5% normalized ΔF/F). Shaded regions denote mean ± s.e.m. across recordings. Heat map shows triggered average for each recording, sorted as in f. i, Timing analysis showing the lag of the trough in the ΔF/F-acceleration cross-correlations for each recording from Calb1 and Vglut2, as shown in f (same recordings and n). Mean Vglut2 = 0.42, Calb1 = 0.17; P value for comparison = 1 × 10⁻⁶ (two-sided Wilcoxon rank-sum test with Bonferroni correction, same n as f). Error bars denote mean ± s.e.m. Analogous analysis conducted for triggered averages in Extended Data Fig. 6f,g. j–l, PCA conducted on ΔF/F-acceleration cross-correlations for all striatal recordings from Vglut2, Calb1 and Anxa1 subtypes. j, ±PC1 and ±PC2 loadings (gray) and their combinations (black), which represent the different quadrants shown in k–l. Together, PC1 and PC2 account for 84.3% of variance of all cross-correlations (PC1 = 64.2% of variance, PC2 = 20.1%). k, PC scores for each recording of each subtype and DAT along PC1 and PC2. X shows mean for each subtype. l, Radial histogram showing the PC1/PC2 angle of each recording in k. P values for comparison between subtypes VC = 2 × 10⁻⁷, VA = 4 × 10⁻¹¹ and CA = 2 × 10⁻⁴ (two-sided Wilcoxon rank-sum test with Bonferroni correction). Acc, acceleration; Cross-corr, cross-correlation; Rec. no., recording number.

