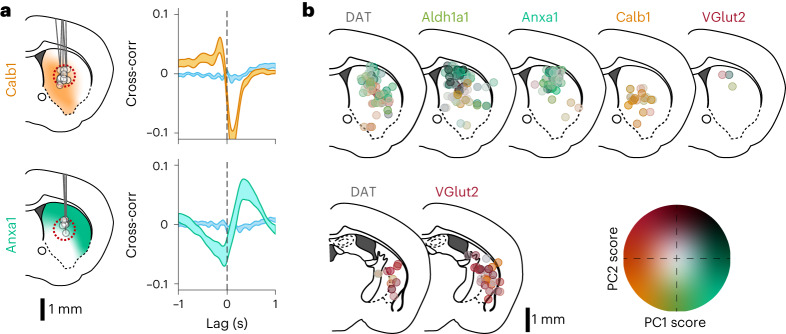
Fig. 3. Spatial distribution of subtype-specific locomotion responses.
a, Comparison of locomotion response (cross-correlation between ΔF/F and acceleration) for Calb1 and Anxa1 recordings only from a region of striatum where their axons overlap, dashed red circle (1-mm diameter). Isosbestic controls in blue. Shaded areas denote mean ± s.e.m. Calb1 mice = 4, n = 5 recordings; Anxa1 mice = 5, n = 16 recordings. b, Locomotion response (PC1/PC2 angle, as shown in Fig. 2l) mapped onto recording location for each subtype and DAT. Locations from the body (top) or the tail of the striatum (bottom) were collapsed into a single brain section. To reduce overlap, locations were shifted a random amount between ±0.4 mm mediolaterally. See Extended Data Fig. 6a for an expanded version of this panel without shifts or collapsing slices together. Cross-corr, cross-correlation.

